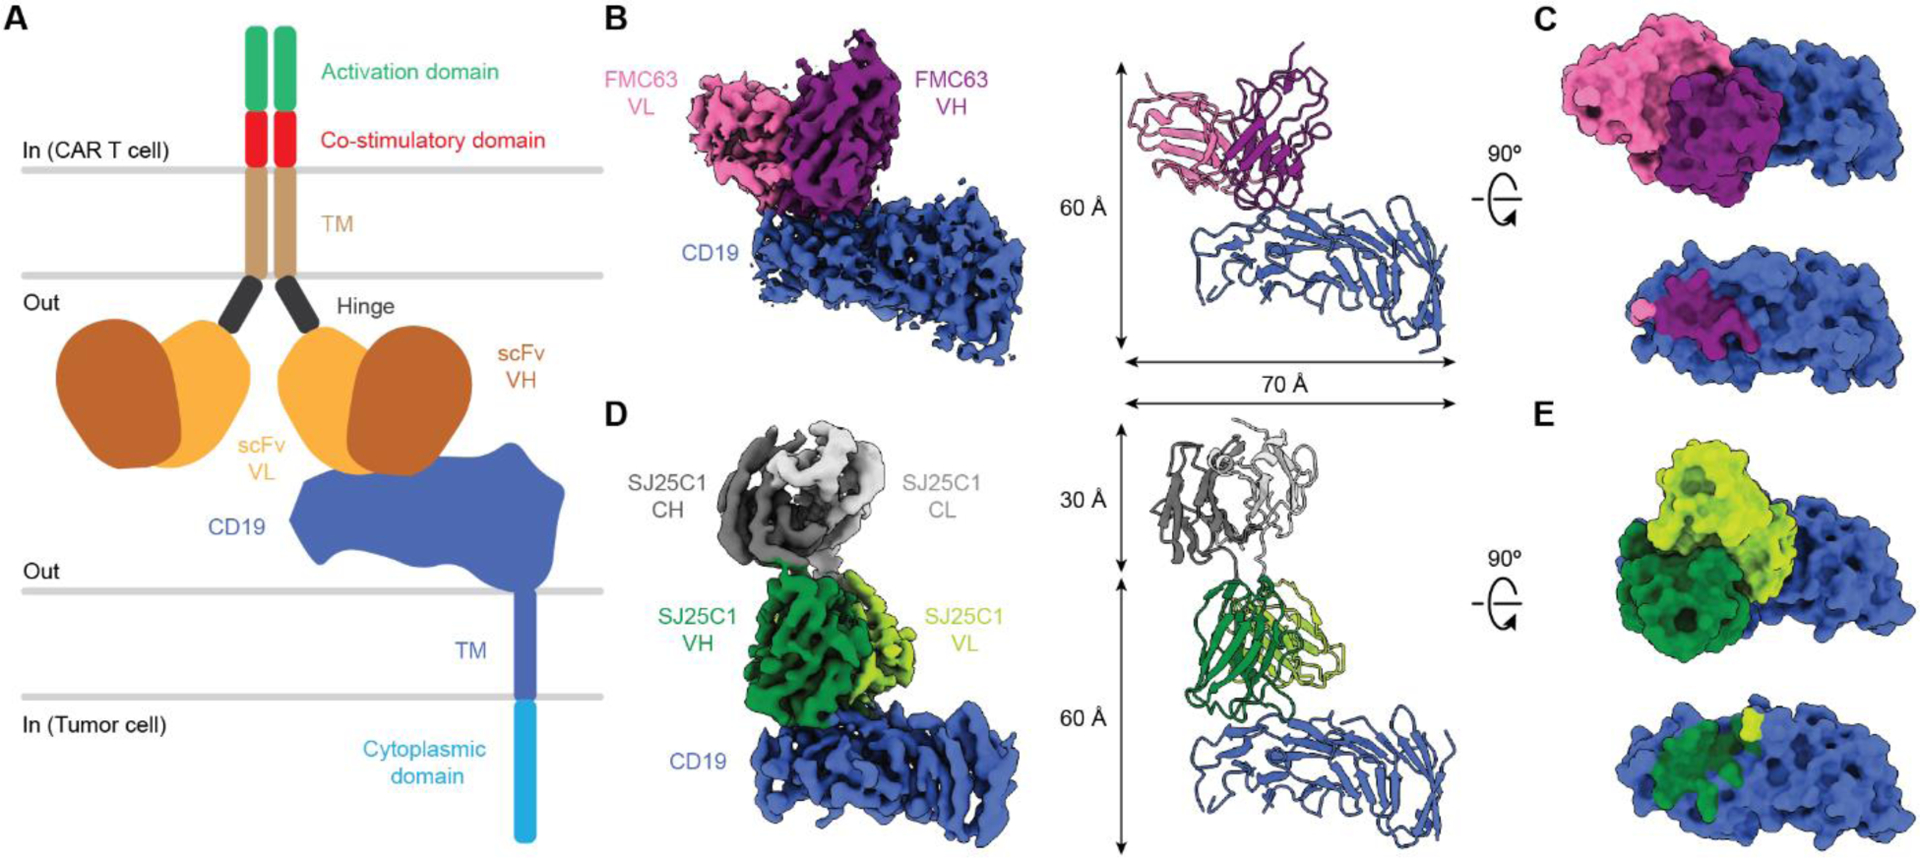
Fig. 1. Structures of CAR binders in complex with CD19.

(A) Illustration of a CAR on a CAR-T cell in complex with CD19 antigen displayed on a tumor cell. (B) Cryo-EM density map (left) and molecular model (right) of FMC63 scFv in complex with CD19. (C) Surface view of the FMC63-CD19 complex as shown perpendicular to the membrane (top). CD19 is also shown in surface view with the footprint of FMC63 colored by contact with the VL or VH region (bottom). (D) Cryo-EM density map (left) and molecular model (right) of SJ25C1 Fab in complex with CD19. (E) Surface view of the SJ25C1-CD19 complex as shown perpendicular to the membrane (top) but with the Fab constant regions (CH and CL) omitted for clarity. CD19 is also shown in surface view with the footprint of SJ25C1 colored by contact with the VL or VH region (bottom). In (C) and (E), the footprints of the binders on CD19 correspond to CD19 residues within 4 Å of each respective binder. TM, transmembrane; CL, light chain constant domain; CH, heavy chain constant domain.
