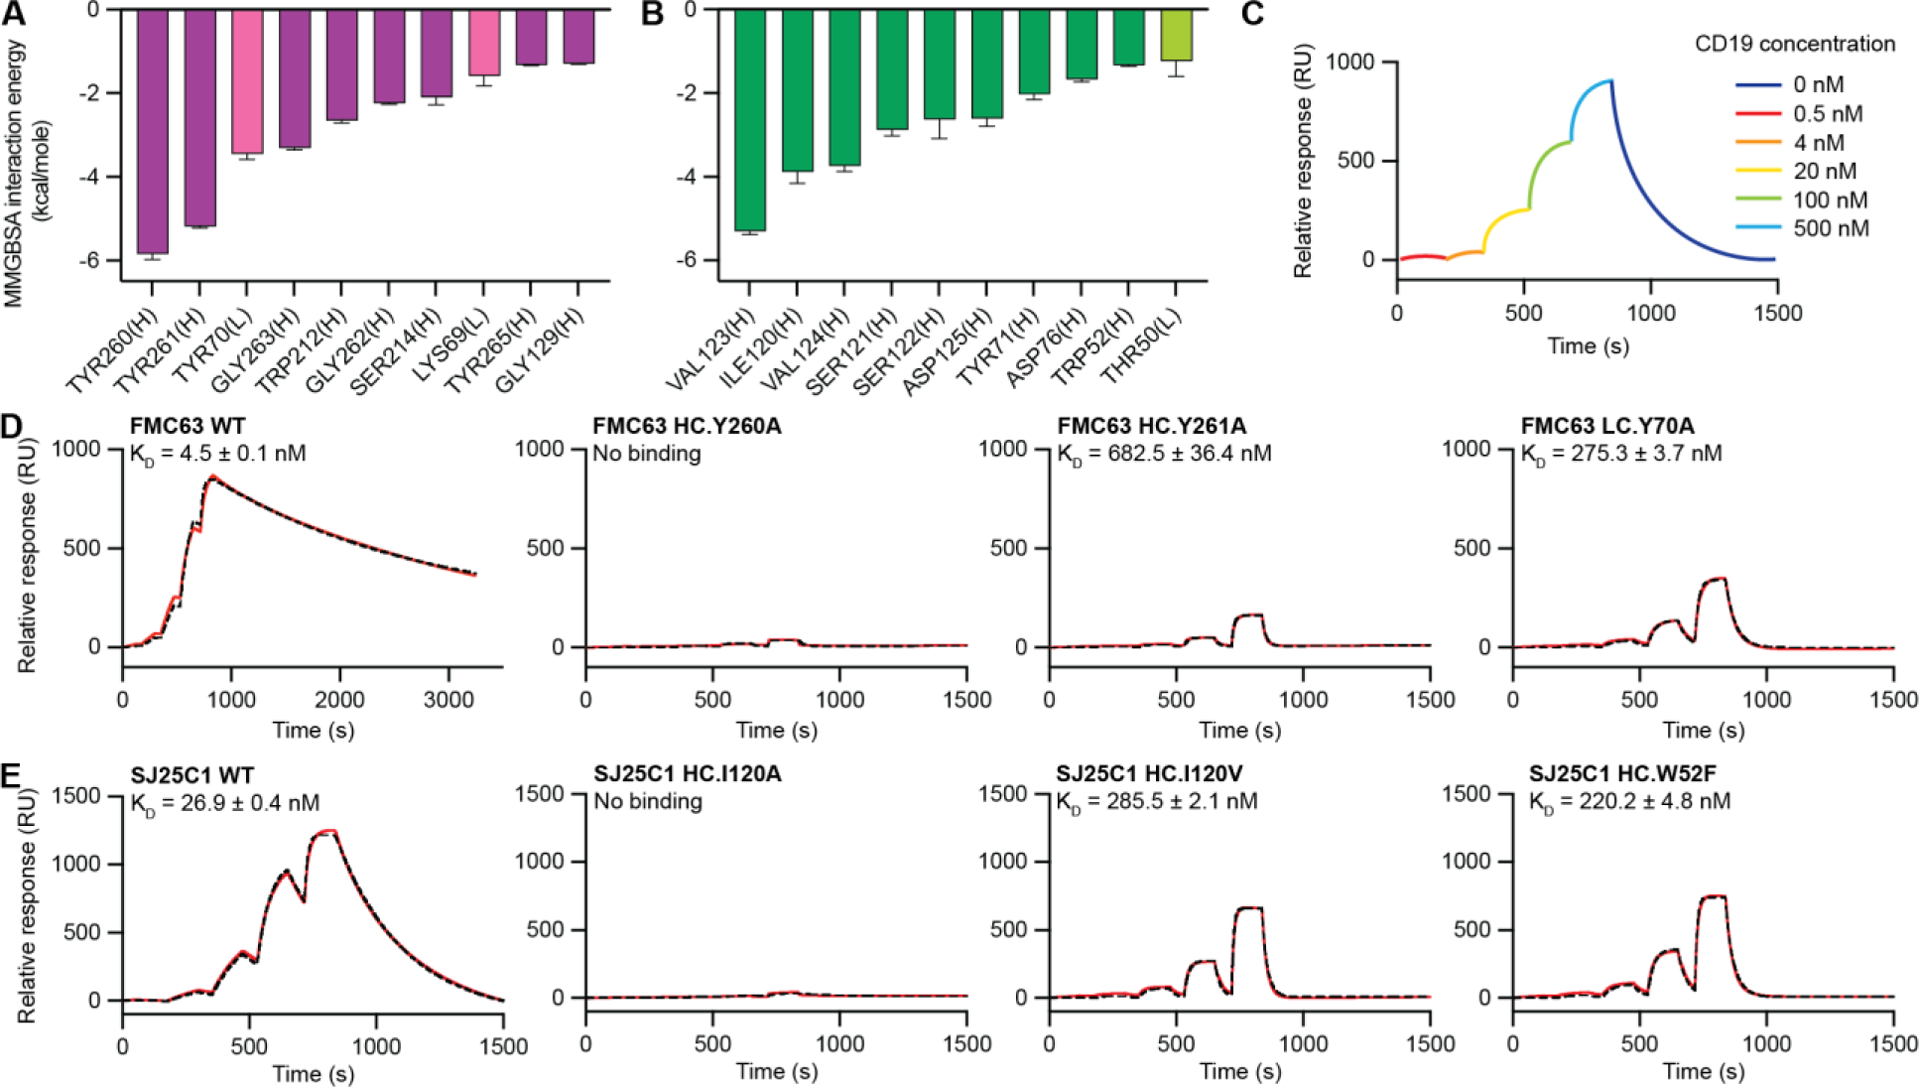
Fig. 3. Affinity measurements of CAR binder mutants.

(A and B) Binding energies for residues from FMC63-CD19 (A) and SJ25C1-CD19 (B) complexes obtained from MM/GBSA analysis of the MD trajectories. Residues were ordered by decreasing magnitude of per-residue binding energy at the interface with CD19 (left to right). The binding energies are quantified by averaging six independent MM/GBSA simulation decompositions for each residue. Error bars represent means ± SEM. Residues from the VL and VH domain are labeled with “(L)” and “(H),” respectively. Data for the VL domain residues are shown using lighter colored bars. (C) Illustrated SPR sensorgram depicting the experimental protocol used to measure CD19 binding to Fabs. Single-cycle kinetics was performed by injecting CD19 protein at five concentrations (0.5, 4, 20, 100, and 500 nM) followed by one long dissociation step and reported with response units (RUs). (D and E) SPR sensorgrams of binding kinetics between CD19 and FMC63 (D) and SJ25C1 (E) binders. Experimental data are shown in red. Fitted curves calculated using 1:1 kinetics Langmuir binding model are shown with black dashed lines. Dissociation constant (KD) for each binder is displayed as an average of triplicates with SEM.
