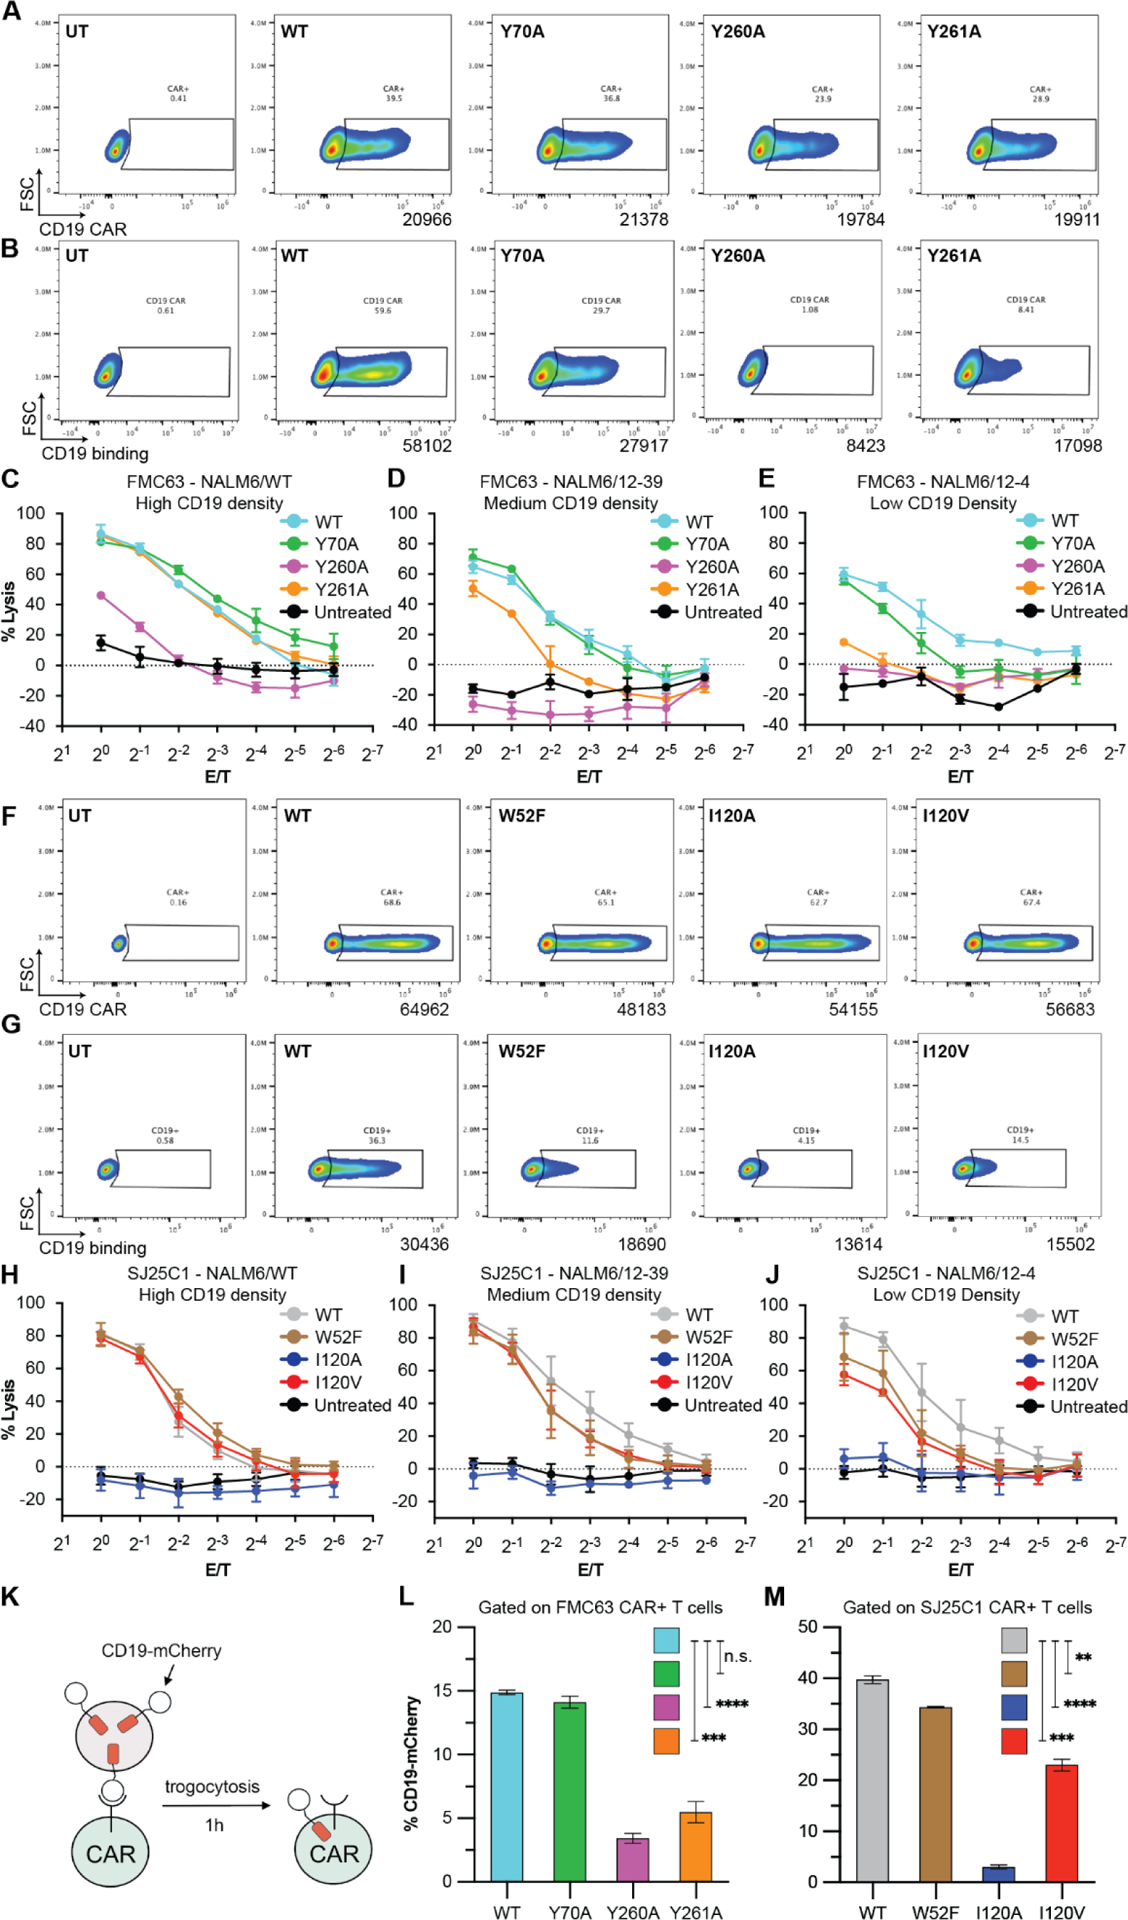
Fig. 4. CD19-interacting residues differentially shape CAR T cell function.

(A and F) CAR expression analyses for FMC63 (A) and SJ25C1 (F) CAR T cells. Data are from two independent experiments using different T cell donors. (B and G) Binding activity for FMC63 (B) and SJ25C1 (G) CAR T cells. Data for FMC63 CAR T cells are from two independent experiments using different T cell donors (one replicate in each experiment). Data for SJ25C1 CAR T cells are from two independent experiments using different T cell donors (two replicates in each experiment). (C to E and H to J) CAR T cell cytotoxic activity against NALM6/WT (~27,000 CD19 molecules; C), NALM6/12–39 (~2000 CD19 molecules; D), or NALM6/12–4 (~200 CD19 molecules; E) target cells. In (C) to (E), data are means ± SEM (n = 3). In (H) to (J), data are means ± SEM (n = 5, with three replicates from T cell donor 1 and two replicates from T cell donor 2). (K) Illustration of the trogocytosis assay. (L and M) Percentage of FMC63 (L) and SJ25C1 (M) CAR T cells (both CD4 and CD8 cells) with CD19-mCherry signal after coculture with CD19-mCherry–expressing NALM6 cells. Unpaired t test P value for FMC63 CAR T cells (L) or SJ25C1 CAR T cells (M). Data are representative of two independent experiments using two different T cell donors, with each experiment performed with three replicates (n = 3). Error bars are SEM.
