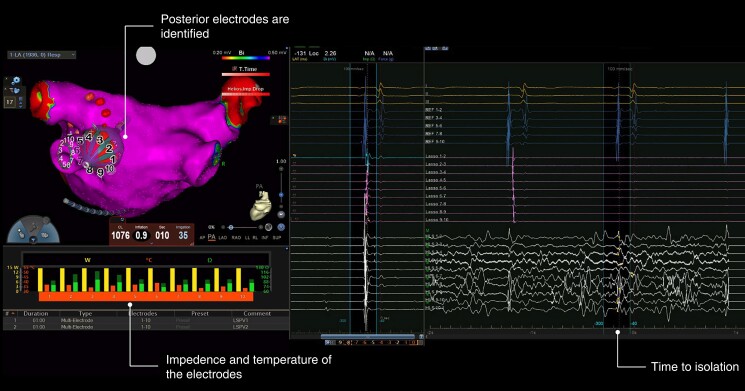
Figure 1.
An example of real time isolation after 10 s of a left inferior pulmonary vein using the RFB. The RFB is displayed in the 3D map of the left atrium in the posteroanterior view. The intracardiac electrograms (EGMs) of the coronary sinus are displayed above, the EGMs of the Lasso Star are displayed in the middle, the EGMs from the RFB surface (note the ablation artifacts) are displayed below. RFB, radiofrequency balloon.

