Figure 1.
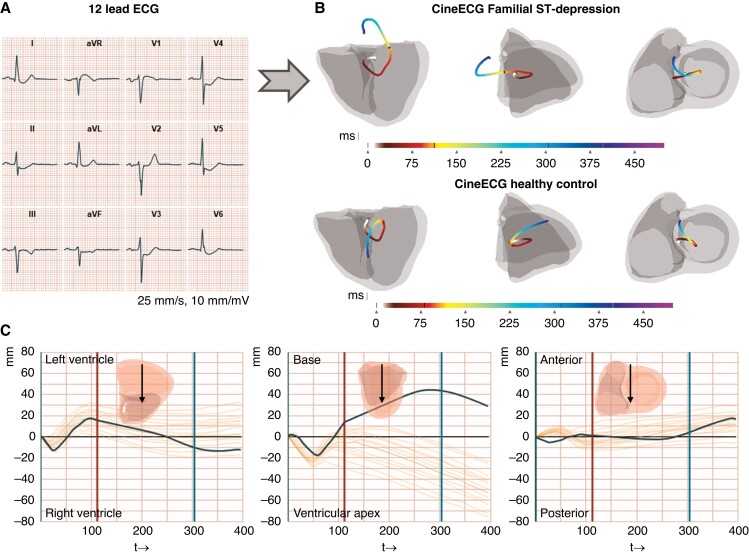
Graphical abstract. CineECG analysis in Familial ST-segment Depression Syndrome. A) A representative median heartbeat of a Familial ST-segment Depression Syndrome (Fam-STD) patient with large ST-depressions in I–II, aVF, and V3–V6. B) Visualization of the electrical pathway derived from a representative Fam-STD patient and a healthy control individual. The electrical activation pathway is shown by the coloured lines starting at 0 ms (start-QRS) and ending at end of the T-wave, units in milliseconds. Four-chamber, right, and left anterior oblique projections are shown. C) Electrical activation pathway analysis of a representative Fam-STD tracing. The co-ordinate system with time (ms) on the x-axis and direction (millimetres) on the y-axis includes a 95% normal range based on the control group.

