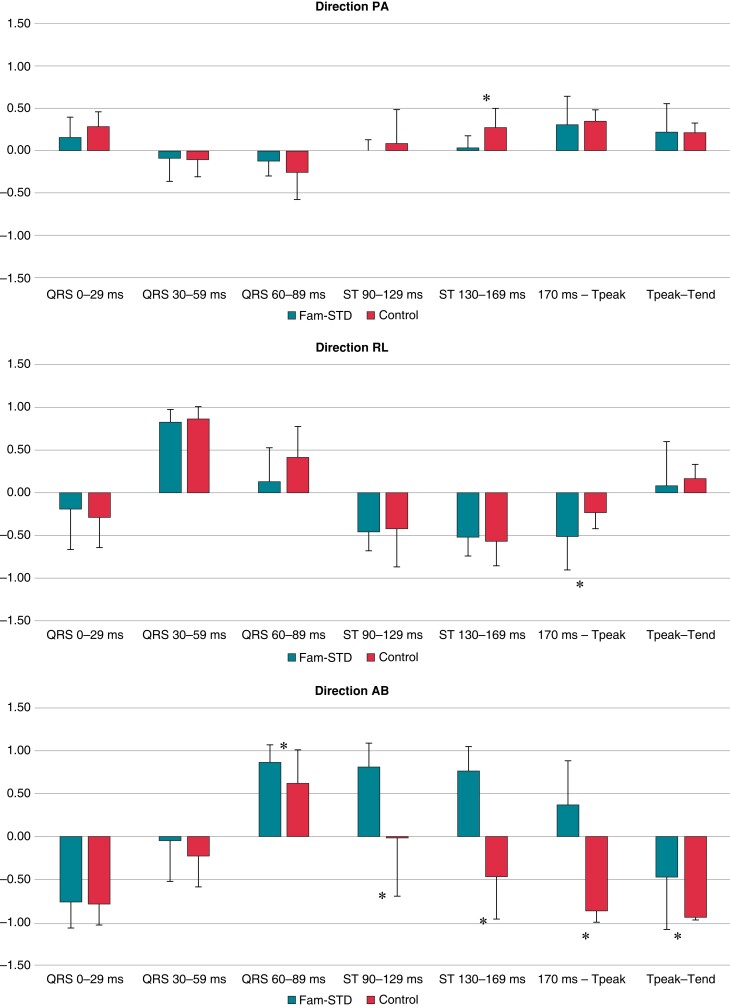
Figure 2.
Analysis of the electrical activation pathway directions. Significant differences for direction PA (ST 90–129 ms), direction RL (170 ms-Tpeak), and direction AB (QRS 60–89, ST 90–129, ST 130–169 ms, 170 ms-Tpeak, and Tpeak-Tend) were observed. Data are presented as means with error bars illustrating standard deviation. *P < 0.001 (0.05/44 = 0.001 after correction for multiple testing). Fam-STD, Familial ST-segment Depression Syndrome.

