Figure 3.
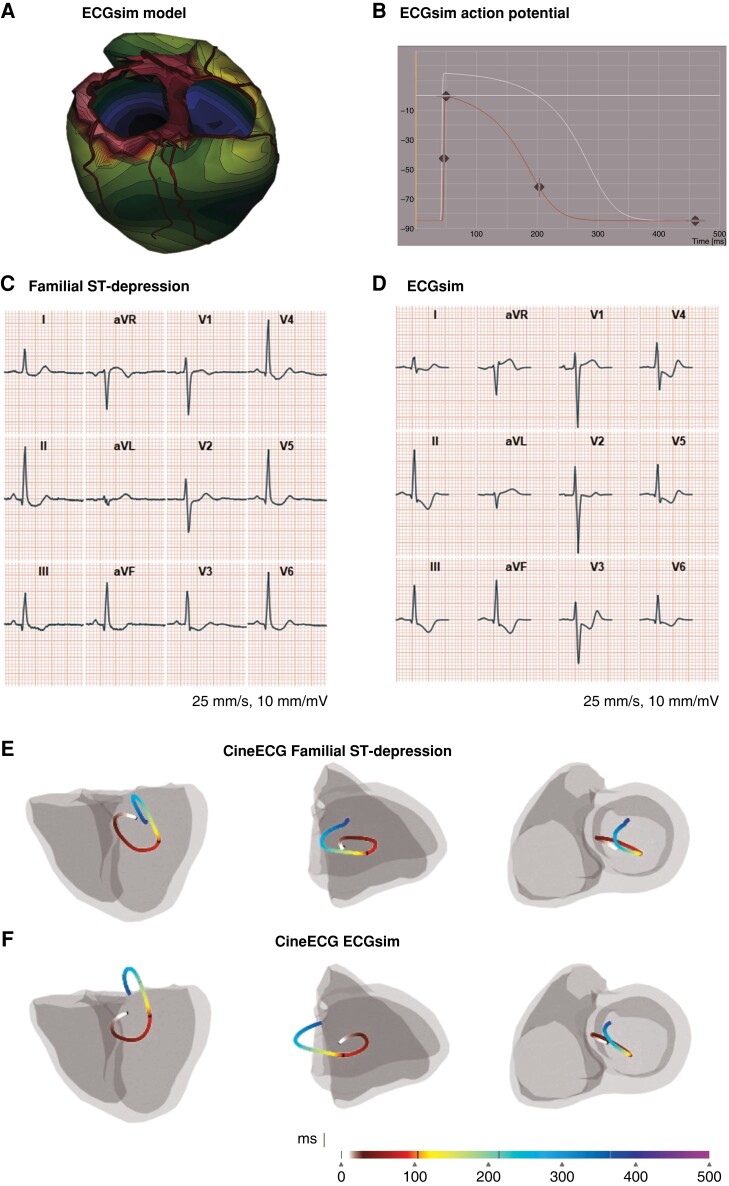
Simulation of the Familial ST-segment Depression Syndrome ECG phenotype. A) ECGsim, the purple areas have reduced the action potential amplitude (APA, mV) and shortened action potential duration (APD, ms). B) ECGsim, showing the adjustments to the action potential in the selected purple area from panel A. Action potential duration (APD, ms) is shown on the x-axis, and the action potential amplitude (APA, mV) on the y-axis. C) ECG complex from a 27-year-old female Familial ST-segment Depression Syndrome (Fam-STD) patient. D) ECG complex from the simulated ECG. E) Electrical activation pathway, derived from 27-year-old female Fam-STD ECG complex. The electrical activation pathway is shown by the coloured lines starting at 0 ms (start-QRS) and ending at end of the T-wave, units in milliseconds. F) The electrical activation pathway, derived from a simulated Fam-STD ECG, showed a very similar pattern as observed in panel E.

