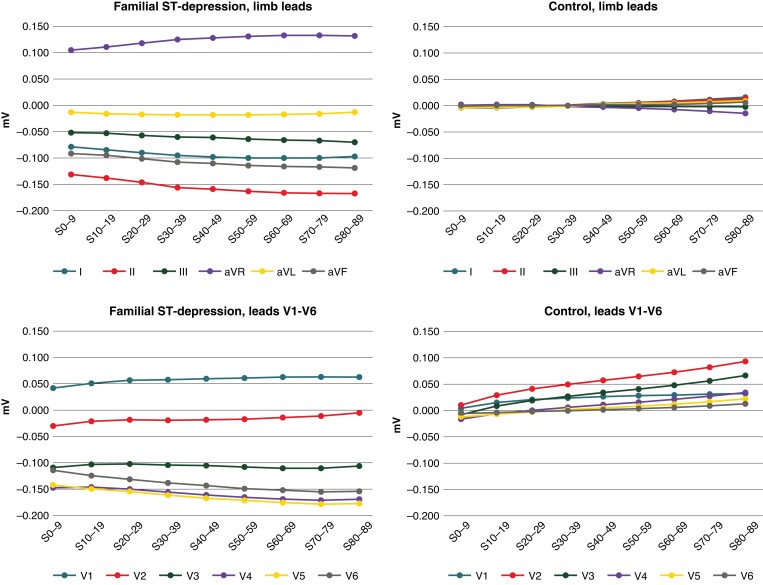
Figure 4.
Detailed ST-segment analyses. Detailed ST-segment analyses of Familial ST-segment Depression Syndrome patients and controls with the ST-segment divided into 10 ms intervals. Time intervals are shown on the x-axis (ms; 0 marks the nadir of the S-wave) and ST-segment amplitudes (in millivolts) on the y-axis. Significant differences (P < 0.01) between patients and controls were found across all nine investigated time intervals.

