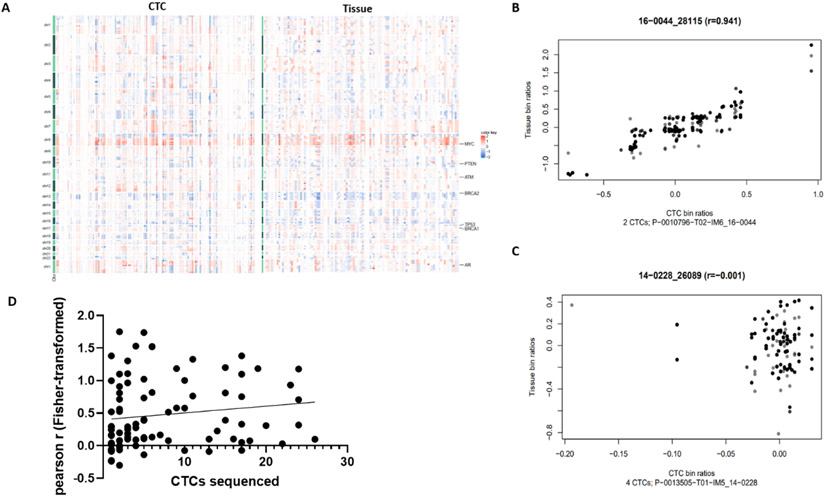
Fig. 3 –
Concordance of CTC copy number profiles. (A) Comparison of whole-genome copy number profiles, with each column representing copy number changes in an individual CTC (left panel) or a tissue (right panel) sample. (B) Scatter plot of bin ratios in composite CTCs (x axis) and tissue (y axis) in a representative patient demonstrating a strong correlation. Gray color is used to separate overlapping data points. (C) Scatter plot of bin ratios in composite CTCs (x axis) and tissue (y axis) in a representative patient demonstrating nonsignificant correlation. Gray color is used to separate overlapping data points. (D) Linear regression model demonstrating a nonsignificant trend towards the association between the number of CTCs sequenced and the CTC-tissue correlation coefficient (91 matched sample pairs plotted). CTC = circulating tumor cell.

