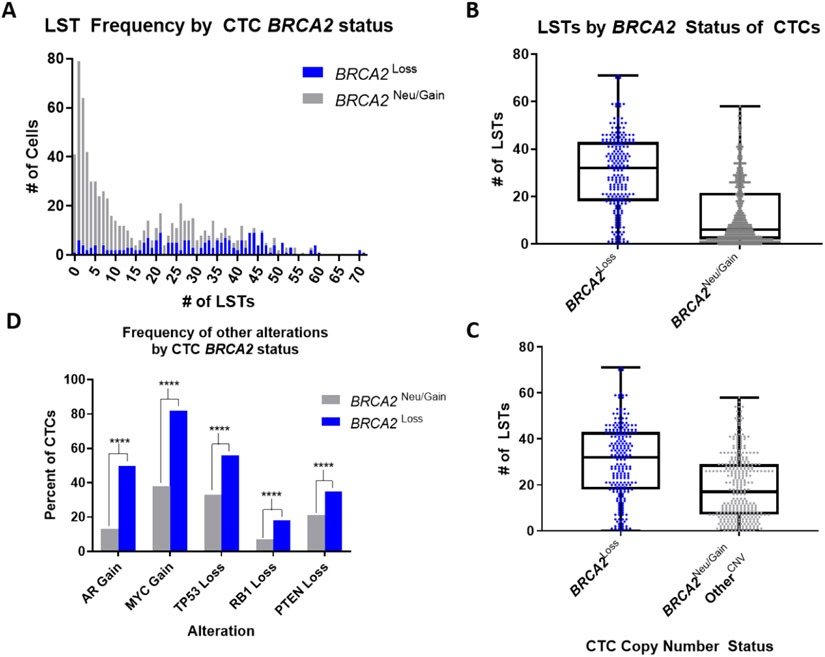
Fig. 5 –
Comparison of genomic instability by CTC BRCA2 status. (A) Frequency of CTCs with (blue; n = 220) and without (gray; n = 565) BRCA2 CNL by LST number. (B) Average number of LSTs per CTC, by BRCA2 loss versus BRCA2 neutral (all n = 785 CTCs). Boxes span from the first to the third quartile, lines are medians, and whiskers are 1.5× IQR (Tukey); all data points are shown. (C) As in Figure 5B, but among CTCs with at least one other copy number variation in AR, TP53, ATYC, PTEN, and/or RBI (n = 324). (D) Prevalence of co-occurring AR, TP53, MYC, PTEN, and/or RB1 copy number variations in CTCs with and without BRCA2 CNL.

