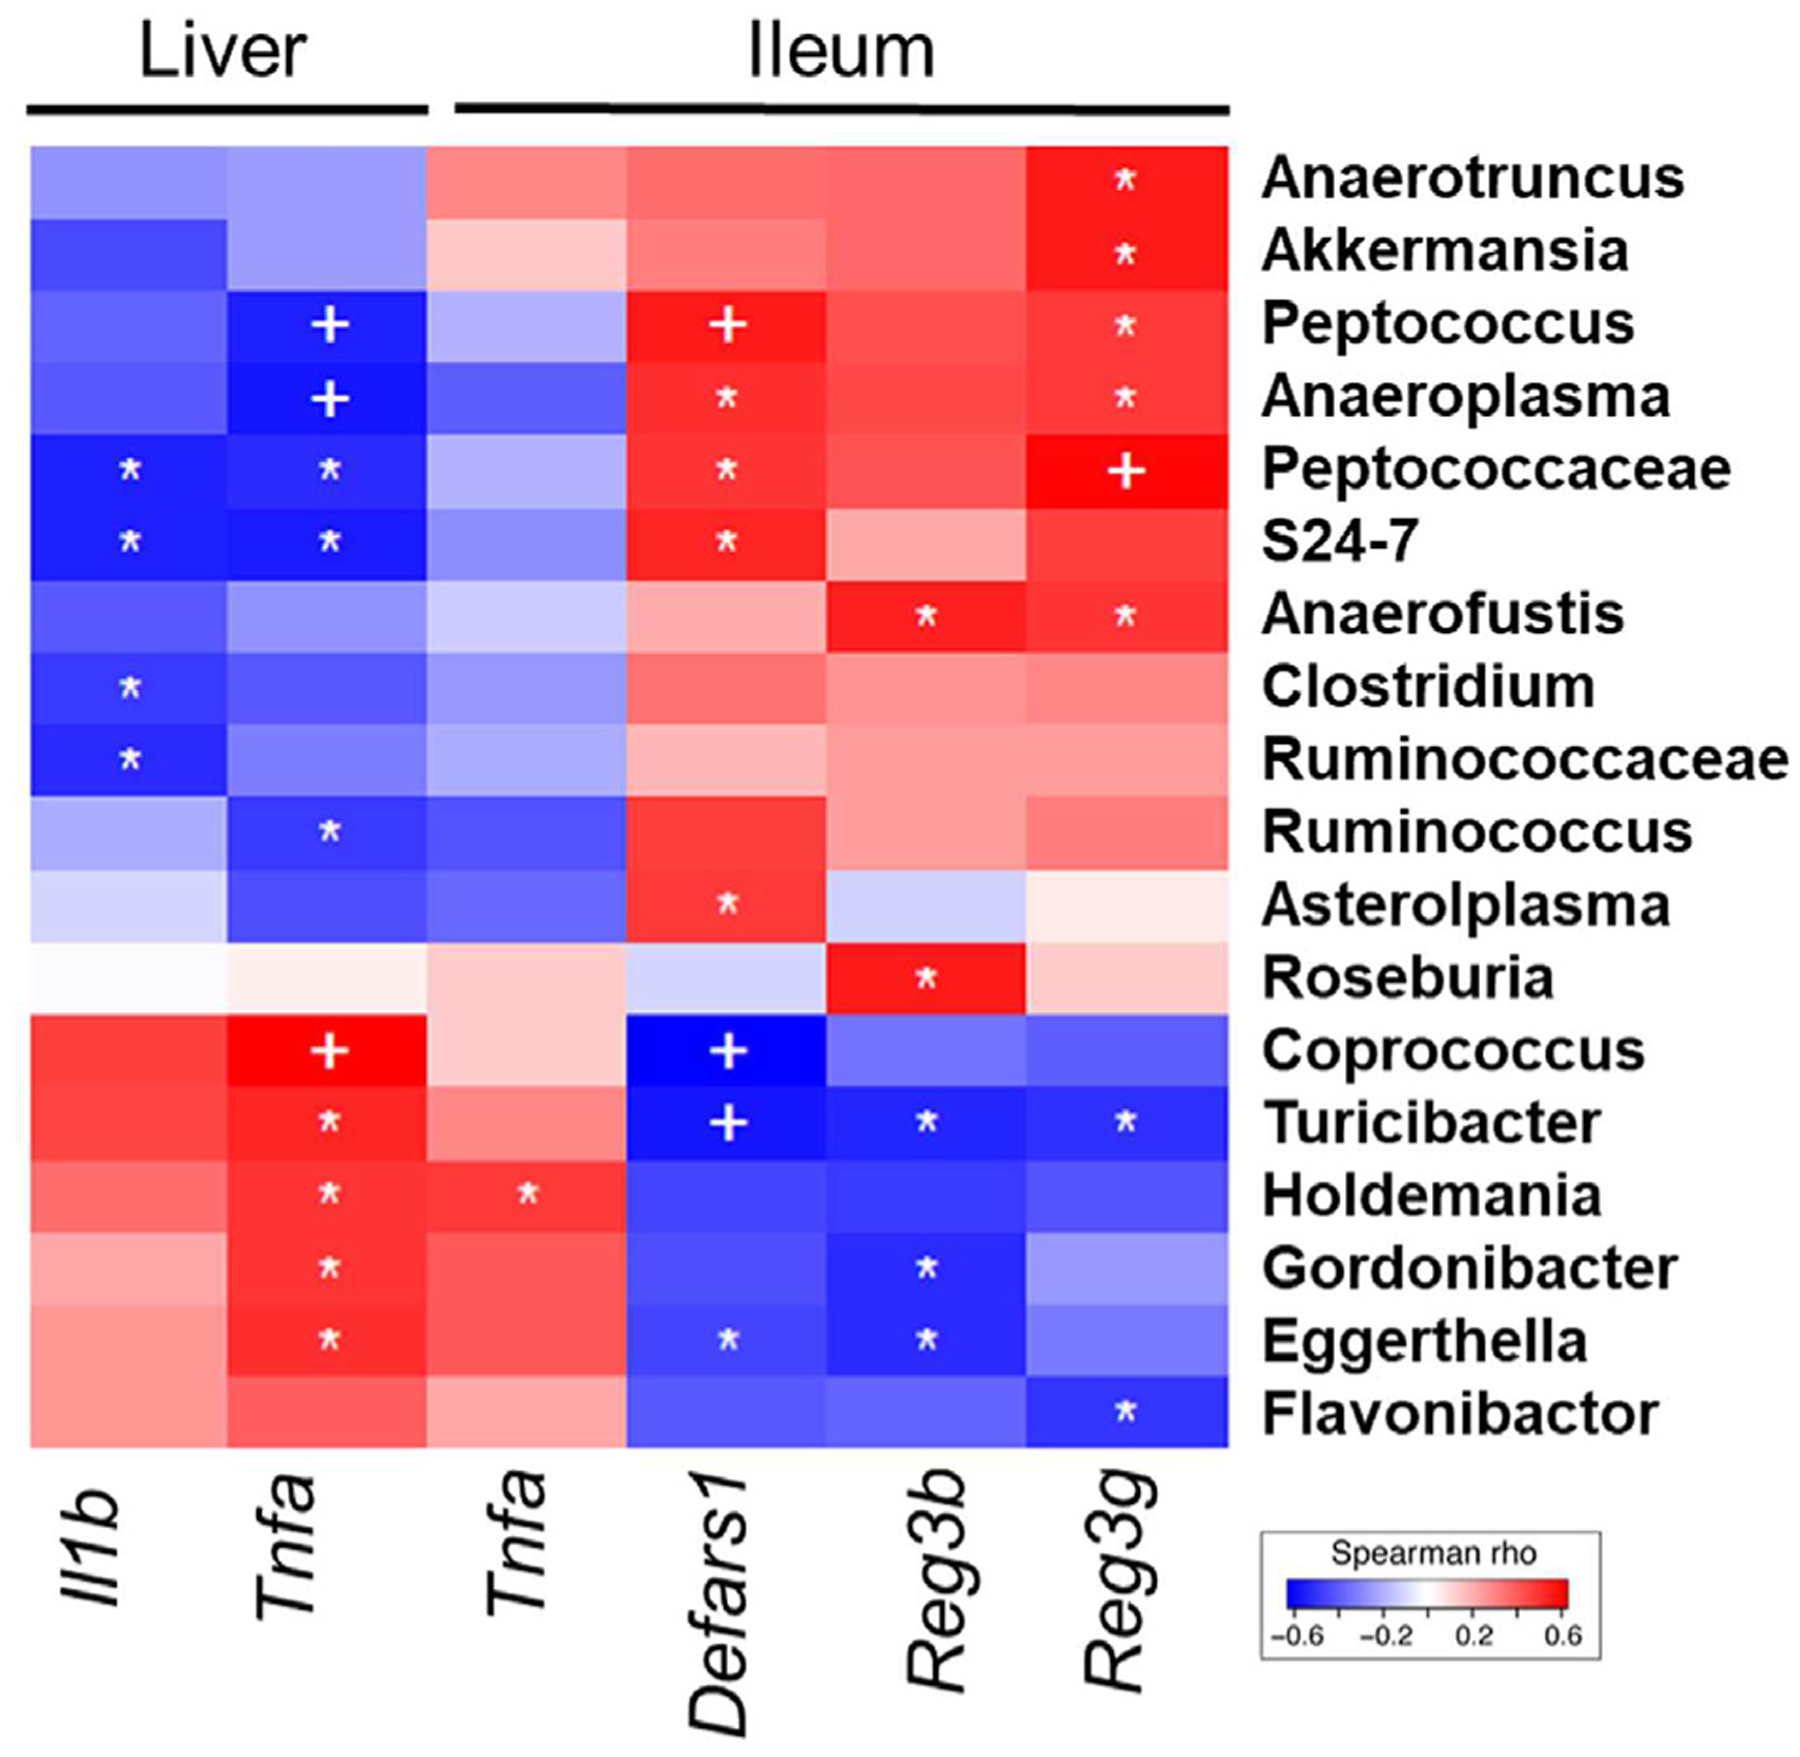
Fig. 4. Correlation of bacterial relative abundance with ileal and hepatic gene expression.

Heat map comparing relative abundance of bacterial taxa to gene expression in the ileum and liver across all treatment groups. Correlations were assessed by the non-parametric Spearman rank correlation test. Blue = negative correlation, red = positive correlation. n = 4–6 per group, +p < 0.01; *p < 0.05.
