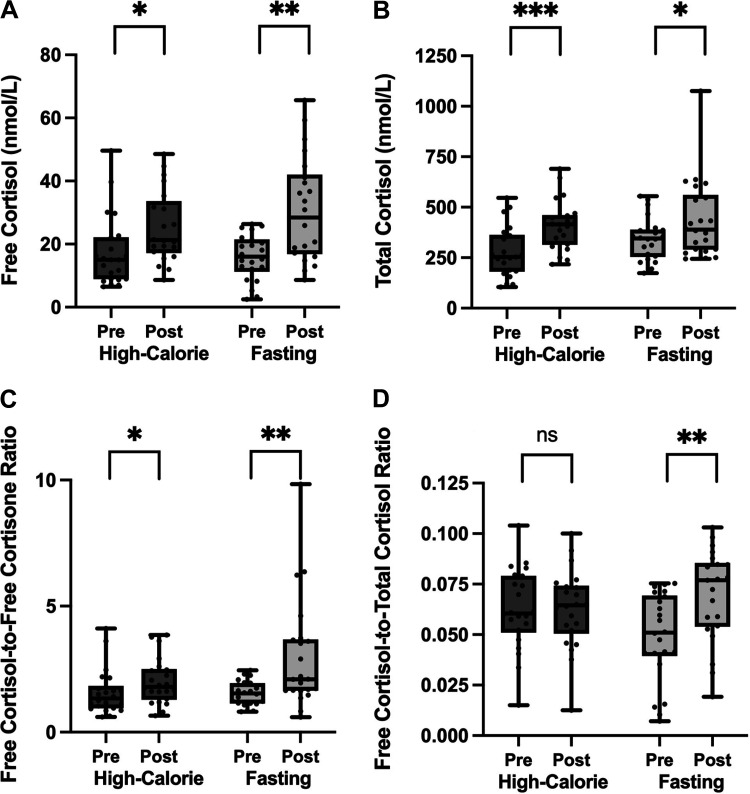
Figure 1.
There was an increase in free cortisol (A), total cortisol (B), and free cortisol-to-free cortisone ratio (C) after a 10-day high-calorie and fasting protocol. There was no change in the free cortisol-to-total cortisol ratio after high-calorie visit, but there was an increase after fasting visit (D). “Pre” indicates baseline levels at start of each 10-day visit. “Post” indicates levels at the end of each 10-day visit. Data presented as box and whisker plots with boxes representing median and interquartile range and whiskers representing minimum and maximum values. ns (not significant) indicates P > 0.05, *P ≤ 0.05, **P ≤ 0.01, ***P ≤ 0.001.

