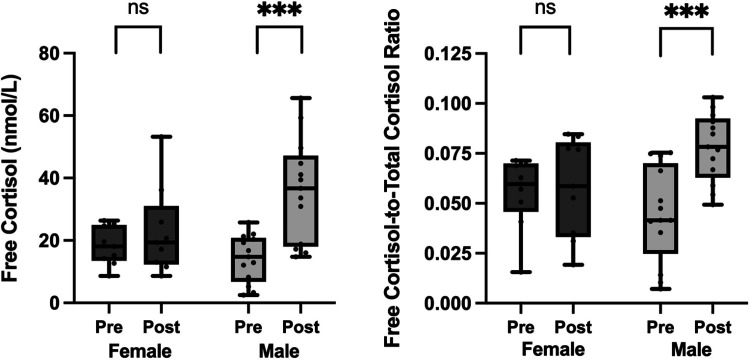
Figure 2.
Free cortisol and free cortisol-to-total cortisol ratio increased after 10-day fast in men but not in women. “Pre” indicates baseline levels at start of each 10-day visit. “Post” indicates levels at the end of each 10-day visit. Data presented as box and whisker plots with boxes representing median and interquartile range and whiskers representing minimum and maximum values. ns (not significant) indicates P > 0.05, ***P ≤ 0.001.

