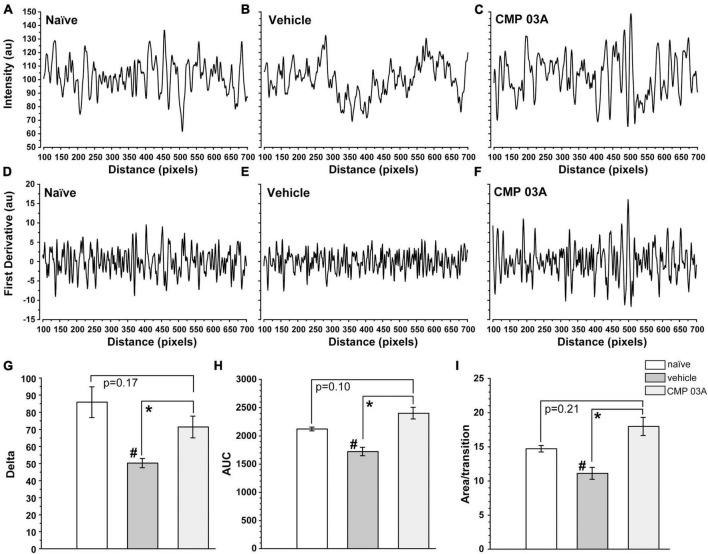
FIGURE 8.
CMP 03A preserves the integrity of the corneal epithelial cell layer. Examples of fluorescence intensity and first-derivative line plots, respectively, in naïve (A,D), vehicle (B,E), and CMP-treated (C,F) mice. Desiccation reduces the amplitude of the derivative compared to naïve; CMP reverses this trend. (G) The transition delta is significantly reduced in the vehicle group compared to naive (#, p = 0.01), which is reversed by CMP 03A (*, p = 0.035). (H) The area under the curve (AUC) is significantly reduced by vehicle compared to naïve (#, p = 0.002); CMP 03A improves this trend compared to vehicle (*, p < 0.001), elevating to naïve levels. Similarly, the area under the curve per transition (I) is significantly reduced in vehicle compared to naïve (#, p = 0.008). CMP 03A improves this compared to vehicle (p = 0.001), once again to naïve levels. Results obtained from imaging as described in Figure 7 and replicated as follows: n = 3 (naïve), 6 (vehicle), and 8 (CMP 03A).

