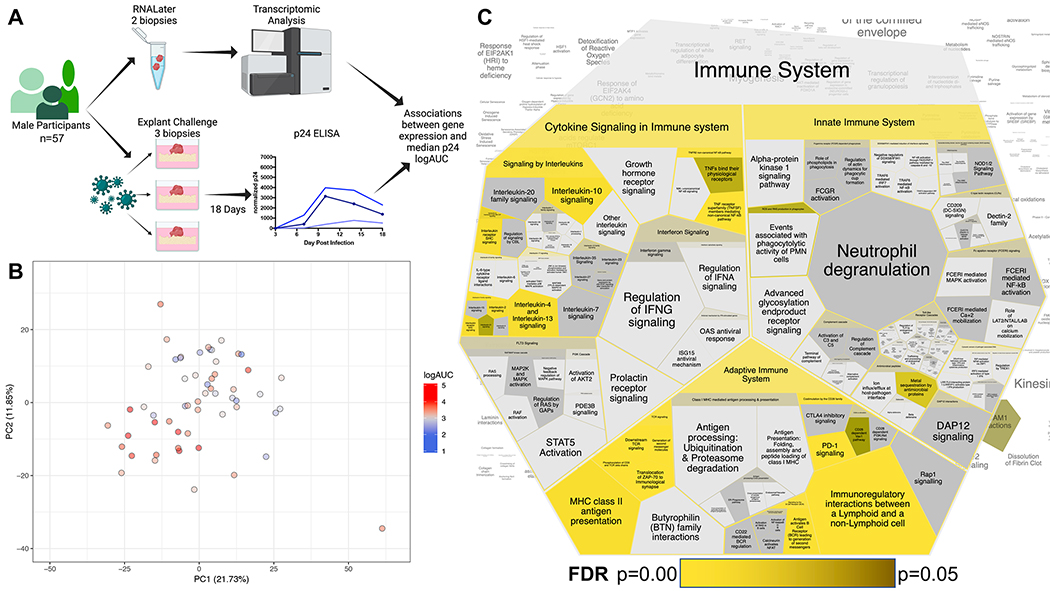
Figure 1. RNAseq transcriptomic analyses and ex vivo challenge of rectal mucosal tissue reveals associations with increased HIV replication.
A) Schematic of study procedures created with BioRender.com, in part. B) PCA plot illustrating diversity of participant rectal mucosal transcriptomes. Circle color is indicative of participant median p24 logAUC on a continuous gradient scale from low (blue) to high (red). C) Voroni diagram illustrating ‘Immune System’ pathways after Reactome analysis of the 181 significantly upregulated differentially expressed genes. Each cell represents a sub-pathway. Cell size is proportional to the proteins/molecules annotated within the pathway, not the query set. Significance of pathway enrichment is highlighted in yellow (most significant entities FDR) gradient to yellow-black (p=0.05), non-significant pathways remain gray.

