Figure 2.
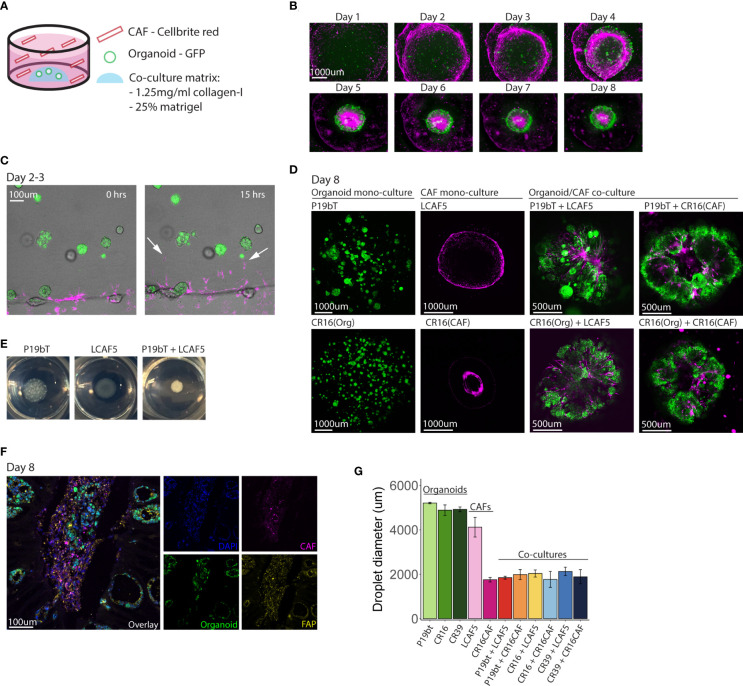
Spontaneous reorganization of cancer cells and CAFs into macroscopic mini-tumors. (A) Schematic overview of the co-culture model. Small GFP expressing organoids (n=600) are plated in a co-culture matrix containing Matrigel and collagen-I, CAFs stained with Cellbrite red dye (n=28,000) are plated in suspension in the well. (B) Fluorescence pictures taken with the EVOS M5000 microscope showing the time line of co-culture formation during the course of 8 days. The organoid P19bT is in green, LCAF5 is in magenta. (C) Two stills from a live cell imaging experiment conducted on the night of day 2 going on day 3 (full movie in Supplemental Data ). The organoid is P19bT and the CAF line is LCAF5. During the course of 15 hours CAFs migrate into the matrix droplet, indicated by the white arrows. (D) Confocal images of organoid mono-cultures, CAF mono-cultures and Organoid/CAF co-cultures after 8 days. Organoids are in green, CAFs are in magenta (E) Pictures taken from the P19bT organoid mono-culture droplet, LCAF5 mono-culture droplet and P19bT/LCAF5 co-culture droplet on day 8. The co-culture droplet strongly contracted forming a macroscopically visible ‘mini tumor’. (F) Immunofluorescence image of FAP expression in a co-culture cryosection of P19bT organoid with LCAF5. (G) Diameter quantification of the matrix droplets after 8 days in culture. Bars represent the mean diameter of 5 droplets, error bars represent SD.

