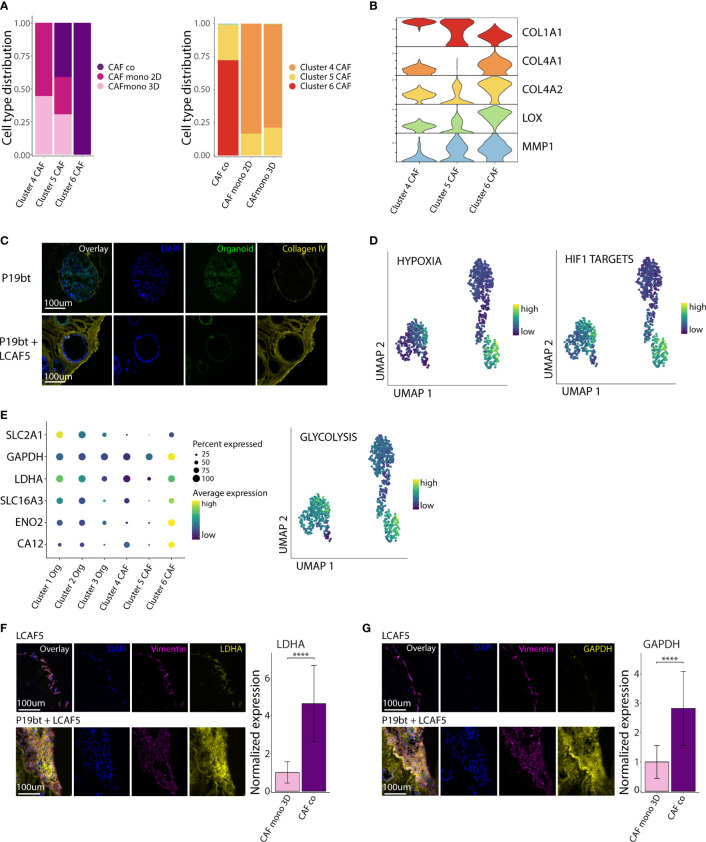
Figure 4.
CAFs in co-culture acquire a hypoxic, glycolytic and matrix-remodeling phenotype. (A) Bar charts with cell type distribution of the 3 CAF clusters across the experimental conditions. (B) Stacked violin plot of genes related to Extra Cellular Matrix (ECM) remodeling across the 3 CAF clusters. (C) Immunofluorescence images of Collagen IV staining of the P19bT mono-culture and the P19bT + LCAF5 co-culture. (D) UMAP plots showing the expression of the Hypoxia hallmark gene signature and the HIF1 targets gene signature across all cells. (E) Gene expression dot plot showing the expression of several glycolysis associated genes and UMAP plot of the Glycolysis hallmark gene signature. (F) Immunofluorescence images of LDHA staining of the LCAF5 mono-culture and the P19bT + LCAF5 co-culture. Bar chart showing expression of LDHA in mono-cultured CAFs and co-cultured CAFs. Bars represent the mean normalized LDHA expression, error bars represent SD. **** = p <0.0001. (G) Immunofluorescence images of GAPDH staining of the LCAF5 mono-culture and the P19bT + LCAF5 co-culture. Bar chart showing expression of GAPDH in mono-cultured CAFs and co-cultured CAFs. Bars represent the mean normalized GAPDH expression, error bars represent SD. **** = p <0.0001.

