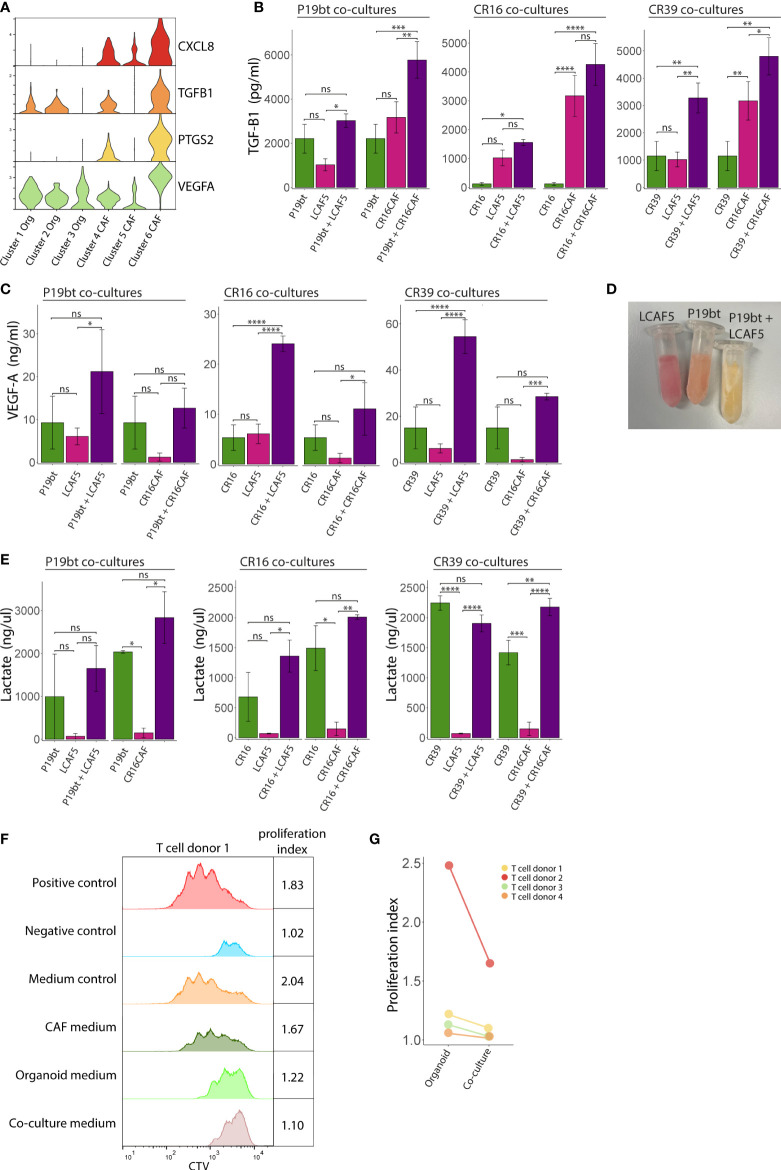
Figure 6.
Generation of an immunosuppressive microenvironment in co-cultures. (A) Stacked Violin plots of immunosuppressive genes showing an increased expression by the co-cultured CAFs (Cluster 6). (B) Bar charts showing the TGF-B1 concentration in the medium from the mono- and co-culture conditions. Bars represent the mean concentration of 3 experiments, error bars represent SD. (C) Bar charts showing the VEGFA concentration in the medium from the mono- and co-culture conditions. Bars represent the mean concentration of 3 experiments, error bars represent SD. (D) Picture of Eppendorf tubes containing the conditioned medium of the CAF mono-culture condition LCAF5, the organoid mono-culture condition P19bT and the co-culture condition P19bT/LCAF5. The pH indicator in the medium clearly shows a decreased pH in the co-culture condition compared to the mono-culture conditions. (E) Bar charts showing the lactate concentration in the medium from the mono- and co-culture conditions, error bars represent SD. (F) Histogram showing the Cell Trace Violet (CTV) expression of one representative T cell proliferation experiment. The organoid conditioned medium peaks show a moderate inhibitory effect on T cell proliferation whereas the co-culture conditioned medium shows the strongest inhibition that somewhat resembles the peak of the negative control. (G) Dot plot showing T cell proliferation indices of the experimental conditions with organoid and co-culture conditioned medium, from four independent experiments. ns, non-significant, Ns = p > 0.05, * = p < 0.05, ** = p < 0.01, *** = p < 0.001, **** = p < 0.0001.

