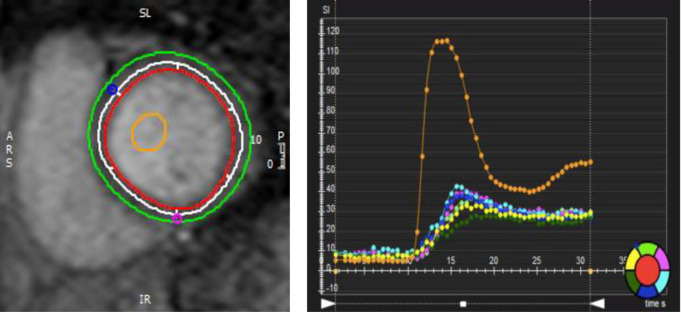
Fig 3.
a. First-pass vasodilatory stress with regadenoson. b-endocardial layer to be analyzed as shown. Endocardium (red) and epicardium (green) contours were manually outlined for sub-endocardial/sub-epicardial myocardial perfusion index ratio analysis. To normalize to the arterial input function, a region of interest was drawn inside the LV blood pool (orange). The white contour circumscribes the subendocardial layer to be analyzed as shown. b. Myocardial signal intensity over time curve of the six myocardial segments and the LV blood pool, represented by the color palette to the bottom right. Myocardial perfusion index is the ratio between the maximum slope of one segment and the maximum slope of the blood pool (orange curve). All six segments were averaged to obtain a global sub-endocardial/sub-epicardial myocardial perfusion index ratio.

