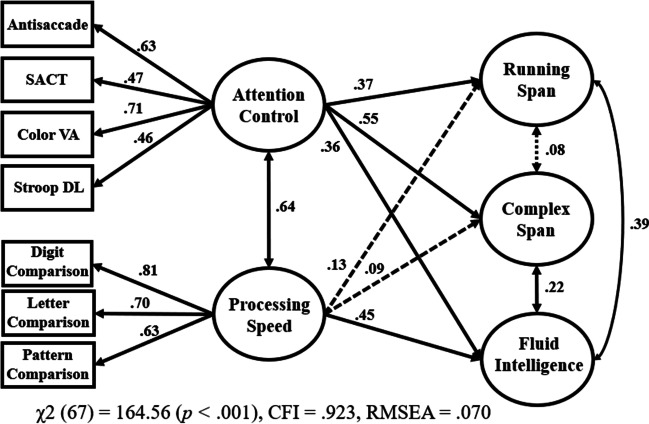
Fig. 6.
Attention control and processing speed as correlated predictors of working memory capacity and fluid intelligence. Note. VA = visual arrays; SACT = sustained attention-to-cue; DL = adaptive response deadline; WMC = working memory capacity; Comp = Comparison. Factor loadings are shown on the right side of each task. For ease of interpretation, some loadings and paths were multiplied by – 1 such that positive values reflect that better performance on a task was associated with better performance on the other task or construct. Solid lines indicate a statistically significant path (p < 0.05) whereas dashed lines indicate a statistically non-significant path

