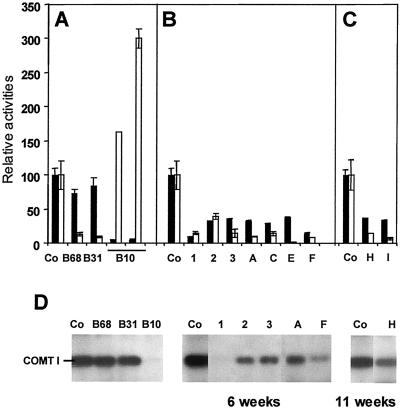
Figure 3.
CCR and COMT I expression in single and double transformants. COMT I and CCR activities were measured on stems of single transformants (A), 6-week-old double transformants (B), and 11-week-old double transformants (C) grown in the greenhouse. Activities are expressed relative to the mean value of five (B) or three (A and C) untransformed controls. Black bars represent the relative COMT I activities and white bars show the relative CCR activities. For each individual transformant, the mean value of duplicates and error bars are presented. In several cases the error bar was too short to be drawn. D, Western-blot analysis of plants tested for enzyme activities in A, B, and C using anti-COMT I antibodies. Co, Control plants. B10, B68, and B31 are ASCOMT I and ASCCR parents, respectively. The progeny of B68 × B10 is indicated by numbers, and the progeny of B31 × B10 is indicated by letters.

