. 2023 May 30;12:e83477. doi: 10.7554/eLife.83477

Figure 1. Pharmacological characterization of the positive allosteric modulators (PAMs), LY298 and VU154, with acetylcholine (ACh) and iperoxo (Ipx) at the human M4 muscarinic acetylcholine receptor (mAChR).

(A) Schematic of the pharmacological parameters that define effects of orthosteric and allosteric ligands on a G protein-coupled receptor (GPCR). (B) A simplified schematic diagram of the Black–Leff operational model to quantify agonism, allosteric modulation, and agonist bias with pharmacological parameters defined (Black and Leff, 1983). (C) 2D chemical structures of the orthosteric and allosteric ligands used in this study. (D–G) Key pharmacological parameters for interactions between orthosteric and allosteric ligands in [3H]-N-methylscopolamine ([3H]-NMS) binding assays. (D) Equilibrium binding affinities (pKi and pKB) and (E) the degree of binding modulation (α) between the agonists and PAMs resulting in the modified binding affinities (F) α/KA and (G) α/KB. (H–K) Key pharmacological parameters relating to Gαi1 activation for interactions between orthosteric and allosteric ligands measured with the TruPath assay (Figure 1—figure supplement 1). (H) The signaling efficacy (τA and τB) and (I) transduction coupling coefficients (log (τ/K)) of each ligand. (J) The functional cooperativity (αβ) between ligands and (K) the efficacy modulation (β) between ligands. All data are mean ± SEM of three or more independent experiments performed in duplicate or triplicate with the pharmacological parameters determined using a global fit of the data. The error in (F, G, K) was propagated using the square root of the sum of the squares. See Table 1. Concentration–response curves are shown in Figure 1—figure supplement 1.

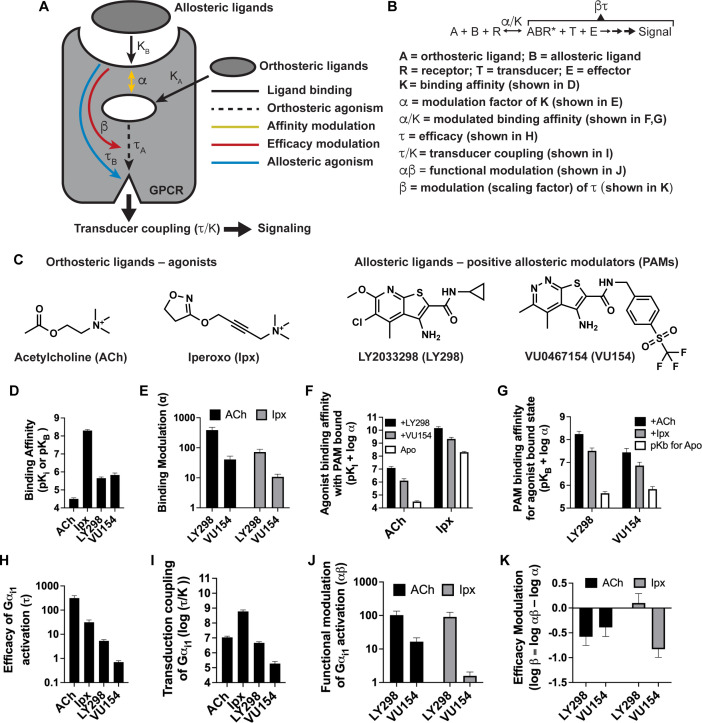
Figure 1—source data 1. Related to Figure 1D–K.

Figure 1.

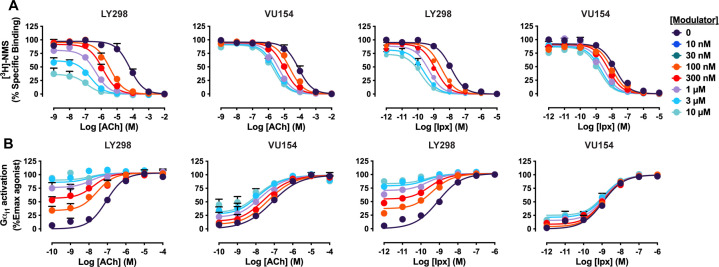
Figure 1—figure supplement 1. Concentration–response curves of interactions between the orthosteric ligands (acetylcholine [ACh], iperoxo [Ipx]) and the allosteric ligands (LY298, VU154) at the human M4 muscarinic acetylcholine receptor (mAChR).

Figure 1—figure supplement 1.

(A) [3H]-N-methylscopolamine ([3H]-NMS) binding assays. (B) Gαi1 activation using the TruPath assay. All data points are mean ± SEM of three or more independent experiments performed in duplicate or triplicate with the pharmacological parameters determined from a global fit of the data. Parameters quantifying the data are shown in Figure 1 and Table 1.
Figure 1—figure supplement 1—source data 1. Related to Figure 1—figure supplement 1.

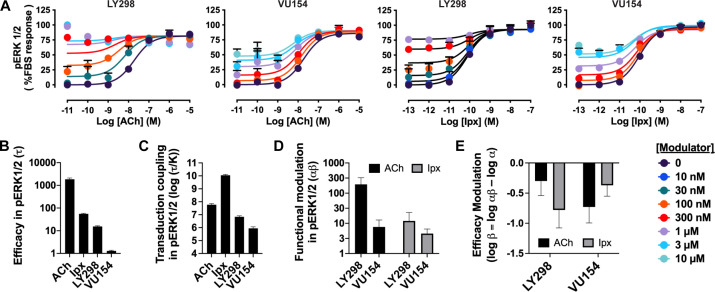
Figure 1—figure supplement 2. Pharmacological characterization of the positive allosteric modulators (PAMs), LY298 and VU154, with acetylcholine (ACh) and iperoxo (Ipx) in pERK1/2 signaling assays.

Figure 1—figure supplement 2.

(A) Concentration–response curves of interactions between the orthosteric and allosteric ligands at the human M4 mAChR in the pERK1/2 signaling assay. (B–E) Quantification of data from (A) to calculate (B) the signaling efficacy (τA and τB), (C) the transduction coupling coefficients (log (τ/K)) of each ligand, (D) the functional cooperativity (αβ) between ligands, and (E) the efficacy modulation (β) between ligands. All data are mean ± SEM of three or more independent experiments performed in duplicate or triplicate with the pharmacological parameters determined from a global fit of the data. The error in (E) was propagated using the square root of the sum of the squares. Pharmacological parameters are reported in Table 1.
Figure 1—figure supplement 2—source data 1. Related to Figure 1—figure supplement 2.