. 2023 May 30;12:e83477. doi: 10.7554/eLife.83477

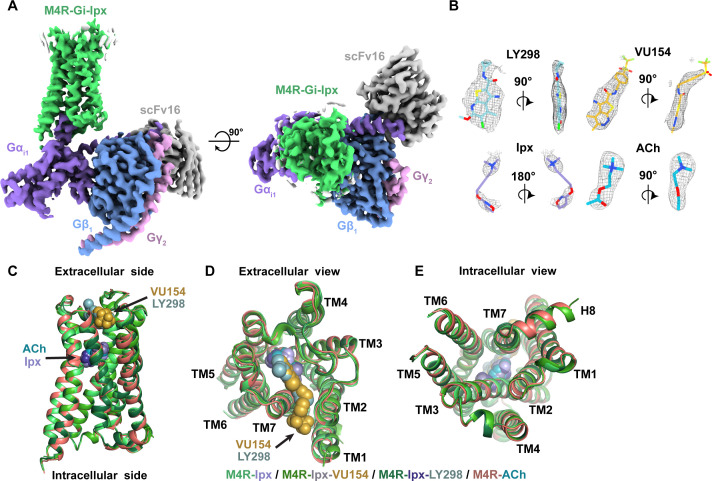
Figure 2. Cryo-electron microscopy (cryo-EM) structures of the M4R-Gi1-scFv16 complexes.

(A) Cryo-EM maps of Ipx-bound M4R-Gi1-scFv16 complex with views from the membrane and the extracellular surface. Cryo-EM maps of the other ligand-bound structures are shown in Figure 2—figure supplement 1. (B) Representative EM density around the ligands in this study. EM-maps of Ipx-, LY298-Ipx-, and VU154-Ipx were set to a contour level of 0.011 and the receptor-focused map of ACh- was set to 0.32. (C–E) Comparison of the receptor models with bound ligands and views from the (C) membrane, (D) extracellular surface, and (E) intracellular surface.

Figure 2.

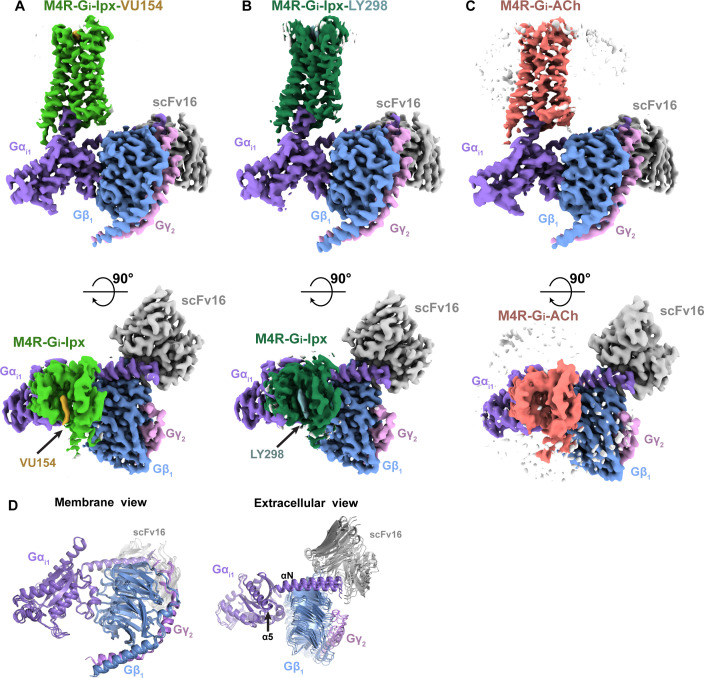
Figure 2—figure supplement 1. Cryo-electron microscopy (cryo-EM) structures of the M4R-Gi1-scFv16 complexes.

Figure 2—figure supplement 1.

(A–C) Cryo-EM maps of (A) VU154-Ipx, (B) LY298-Ipx-, and (C) ACh-bound M4R-Gi1-scFv16 complex with views from the membrane and the extracellular surface. The comparison of receptor models is shown in Figure 2. (D) Comparison of the positions of Gαi112-scFv16 from all four cryo-EM structures with views from the membrane and extracellular surface.
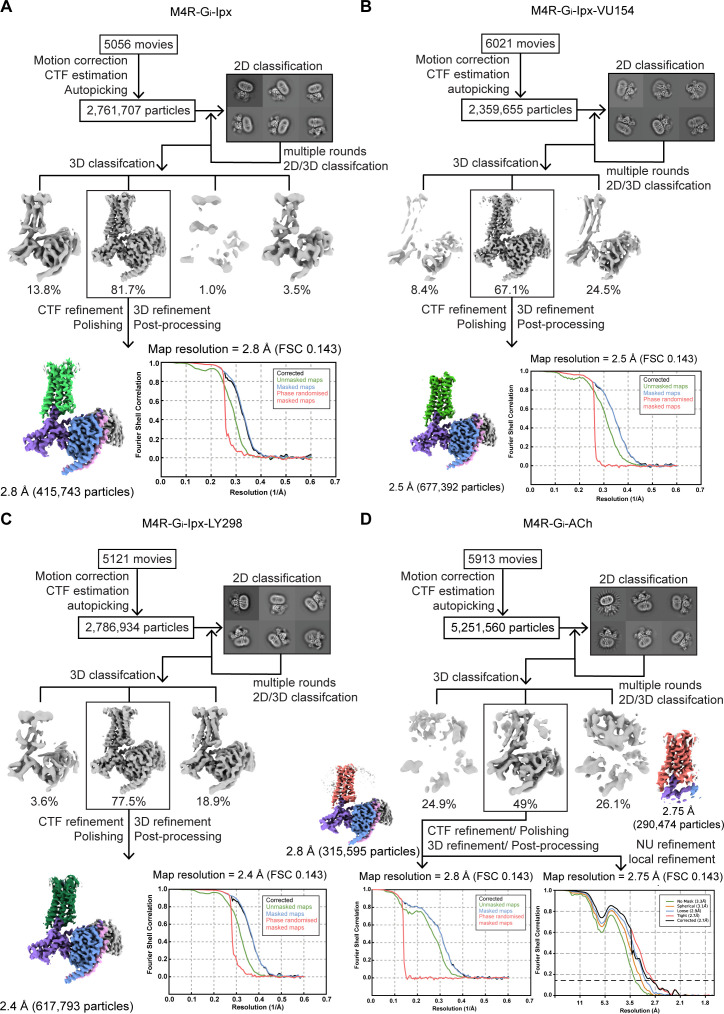
Figure 2—figure supplement 2. Cryo-electron microscopy (cryo-EM) data processing and analysis.

Figure 2—figure supplement 2.

(A–D) Flowchart of cryo-EM data processing of the (A) Ipx-, (B) VU154-Ipx-, (C) LY298-Ipx-, and (D) ACh-bound M4 muscarinic acetylcholine receptor (mAChR) complexes with Gi1-scFv16 including particle selections, 2D and 3D classifications, EM density map, and the Fourier shell correlation (FSC) curves.
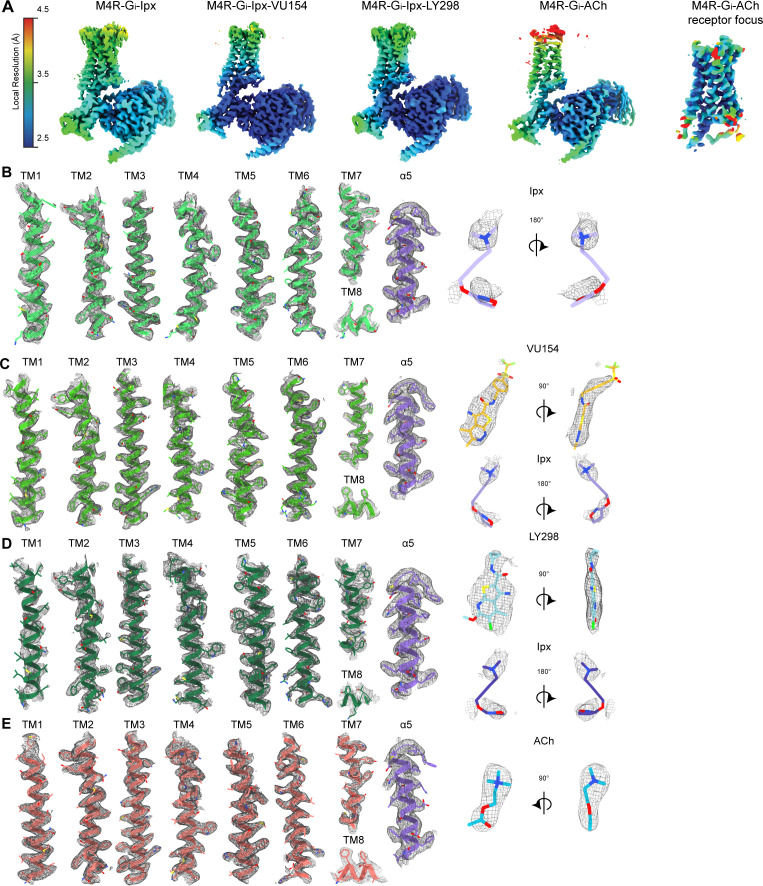
Figure 2—figure supplement 3. Cryo-electron microscopy (cryo-EM) density maps.

Figure 2—figure supplement 3.

(A) EM maps colored by local resolution. (B–E) Representative EM density and modeling for the 7 transmembrane (TM) helices, the C-terminus of Gαi1, and ligands for the (B) Ipx-, (C) VU154-Ipx-, (D) LY298-Ipx-, and (E) ACh-bound M4 muscarinic acetylcholine receptor (mAChR) complexes. EM-maps of Ipx-, LY298-Ipx-, and VU154-Ipx were set to a contour level of 0.011 and the receptor-focused map of ACh- was set to 0.32.
Figure 2—figure supplement 4. Comparison of active state muscarinic acetylcholine receptor (mAChR) structures.

Figure 2—figure supplement 4.

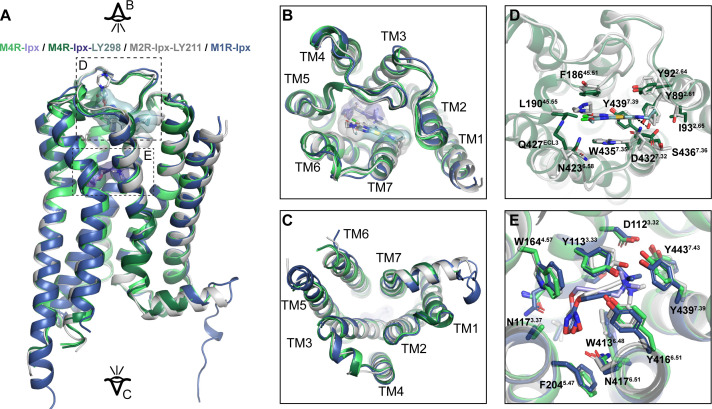
(A) Comparison of the Ipx- and LY298-Ipx-bound M4 mAChR structures to the prior structures of Ipx-bound M1 mAChR and LY2119620-Ipx-bound M2 mAChR cryo-EM structures. Protein Data Bank (PDB) accession codes for the M1 mAChR (PDB: 6OIJ) and the M2 mAChR (PDB: 6OIK). (B, C) Views from the (B) extracellular and (C) intracellular surfaces. (D) Comparison of the binding pose of LY2119620 at the M2 mAChR and LY2033298 at the M4 mAChR. (E) Comparison of the Ipx binding site residues.
Figure 2—figure supplement 5. Comparison of active state M4 muscarinic acetylcholine receptor (mAChR) structures.

Figure 2—figure supplement 5.

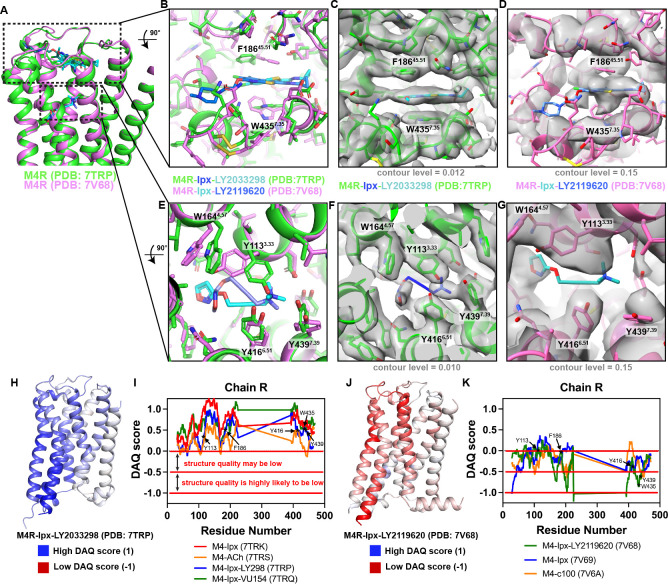
(A) Comparison of LY298-Ipx bound M4 mAChR structure (PDB: 7TRP, receptor colored green, Ipx blue, and LY298 cyan) to the LY2119620-Ipx bound M4 mAChR structure (PDB: 7V68, receptor colored pink, Ipx cyan, and LY2119620 blue) (Wang et al., 2022). (B–D) View of the allosteric binding site from the top of the receptor. (B) Comparison of key allosteric residues F18645.51 and W4357.35 showing different positions of the residues between M4 mAChR structures. (C) Overlay of the EM map (EMD-26100, colored gray) onto the LY298-Ipx bound M4 mAChR structure contoured at 0.012. (D) Overlay of the EM map (EMD-31738, colored gray) onto the LY2119620-Ipx bound M4 mAChR structure contoured at 0.15. There is a lack of EM density surrounding the allosteric residues F18645.51 and W4357.35 at this level of contour and all others. (E–G) View of the orthosteric binding site from the top of the receptor. (E) Comparison of key orthosteric binding site residues. (F) Related to (C) with view from orthosteric site and the EM-map contoured at 0.010. (G) Related to (D) with view from the orthosteric site with mismodeled residues. (H–K) DAQ scores provide an estimation of the local quality of protein models from cryo-electron microscopy (cryo-EM) maps on a per residue basis. DAQ scores were determined from the DAQ web server using the recommended default settings (Terashi et al., 2022). (H, J) DAQ scores from the analysis of (H) the LY298-Ipx-M4R-Gi1 complex and (J) the LY2119620-Ipx-M4R-Gi1 complex mapped onto the cartoon of the receptor chain and color coded by score. A DAQ score that is positive (colored blue at values of 1) indicates a correct assignment. A DAQ score near 0 (colored white) indicates a position in the map that lacks a distinct density pattern for the assigned amino acid. DAQ scores less than 0 (colored red at –1) indicate a position that could be misassigned or poorly fit. (I) DAQ scores for all four M4 mAChR structures reported in this article with DAQ scores of each Cα atom plotted for each residue. Key orthosteric and allosteric residues are denoted by asterisks. Nearly every residue has a value above 0. (K) Similar to (I), but for all three M4 mAChR structures reported in Wang et al., 2022. Very few residues have a score above 0, indicating potential issues with the model and maps.