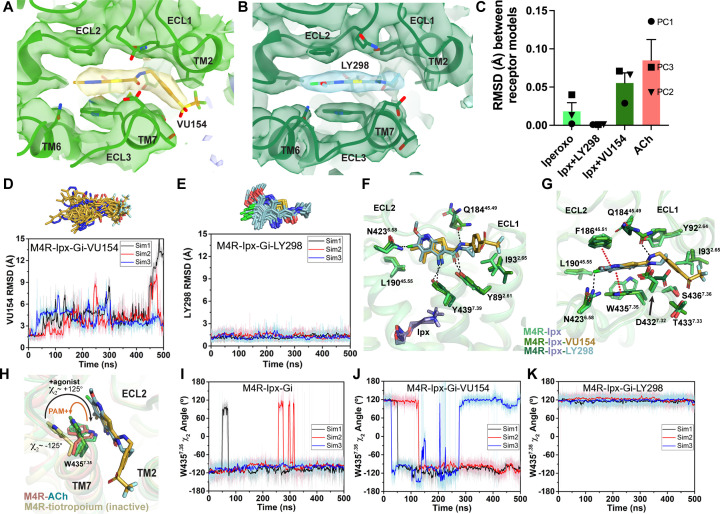
Figure 4. Binding and dynamics of LY298 and VU154.
(A, B) Cryo-electron microscopy (cryo-EM) density of the (A) VU154- and (B) LY298-binding sites. (C) The root mean square deviations (RMSDs) between receptor models of the respective cryo-EM structures that were refined into the first and last frames of the EM maps from each principal component (PC1-PC3) of the 3D variability analysis. Values shown are mean ± SEM. (D, E) Top representative binding conformations of (D) VU154 and (E) LY298 obtained from structural clustering with frame populations ≥1% and time courses of the RMSDs of each positive allosteric modulator (PAM) relative to the cryo-EM structures. (F, G) Binding interactions of VU154 and LY298 with views from the (F) membrane and (G) extracellular surface. (H) Position and χ2 angle of W4357.35 in the tiotropium-, ACh-, Ipx-, VU154-Ipx-, and LY298-Ipx bound structures. (I–K) Time courses of the W4357.35 χ2 angle obtained from Gaussian accelerated molecular dynamics (GaMD) simulations on the (I) Ipx-, (J) VU154-Ipx-, and (K) LY298-Ipx-bound cryo-EM structures. See Table 3.


