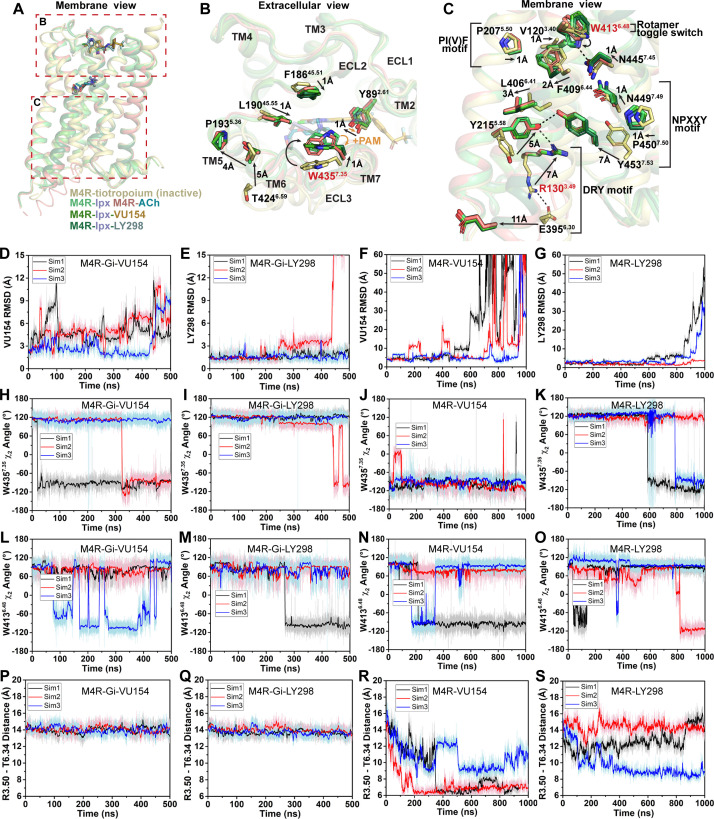
Figure 5. Structural and dynamic insights into orthosteric and allosteric agonism.
(A) Cartoon of the receptor models indicating regions of interest for panels (B, C) shown within the red boxes. (B) View of the tiotropium-bound, agonist-bound, and positive allosteric modulator (PAM)-agonist-bound conformations from the extracellular surface. (C) Membrane view of residues and activation motifs involved in signaling. Residues colored red in (B, C) indicate residues of investigated in Gaussian accelerated molecular dynamics (GaMD) simulations. (D–G) Time course of the root mean square deviations (RMSDs) of the PAMs (D, E) from GaMD simulations of the M4R bound to G protein and no orthosteric agonist, (F, G) and in the absence of both G protein and agonist. (H–K) Similar to (D–G) the time courses of (H–K) the W4357.35 χ2 angle, (L–O) the W4136.48 χ2 angle, and (P–S) the TM3-TM6 distance measured by distance between R1303.50 and T3996.34. See Table 3.

