. 2023 May 30;12:e83477. doi: 10.7554/eLife.83477

Figure 7. A molecular mechanism for the species selectivity for VU154.

(A) Comparison of the cryo-electron microscopy (cryo-EM) structure of the human M4 muscarinic acetylcholine receptor (mAChR) bound to Ipx-VU154 with the AlphaFold model of the mouse M4 mAChR (Jumper et al., 2021; Varadi et al., 2022). The three residues that differ between species and within the core 7TM bundle from the human receptor (V91, D432, and T433) are shown as sticks along with the corresponding residues from the mouse receptor. (B) The binding affinity of VU154 for the Ipx-bound conformation (pKB-Ipx = pKB + α) determined from [3H]-NMS binding experiments. Values calculated with data from Figure 7—figure supplement 1 with propagated error. (C) Efficacy of VU154 (τB – corrected for receptor expression) of pERK1/2 signaling from data in Figure 7—figure supplement 2. (D–K) Time courses of obtained from Gaussian accelerated molecular dynamics (GaMD) simulations of the (D–G) D432E and (H–K) T433R mutant M4R-Ipx-Gi1-VU154 systems with (D, H) Ipx RMSDs, (E, I), VU154 root mean square deviations (RMSDs), (F, J) W4357.35 χ2 angle, and (G, K) W4136.48 χ2 angle. Data shown are mean ± SEM from three or more experiments performed in duplicate with the pharmacological parameters determined from a global fit of the data. *Indicates statistical significance (p<0.05) relative to WT as determined by a one-way ANOVA with a Dunnett’s post-hoc test.

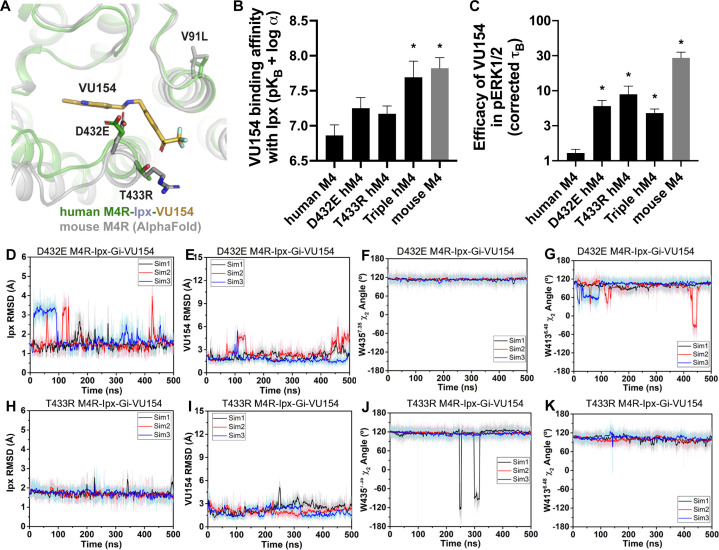
Figure 7—source data 1. Related to Figure 7.

Figure 7.

Figure 7—figure supplement 1. Binding parameters of positive allosteric modulators (PAMs) at the human and mouse M4 muscarinic acetylcholine receptors (mAChRs).

Figure 7—figure supplement 1.

(A) Concentration–response curves of the orthosteric and allosteric ligands in [3H]-NMS binding assays at the mouse M4 mAChR, D432E, T433R, and the V91L, D432E, T433R triple mutant of the human M4 mAChR. (B–D) Quantification of data from (A) to calculate (B) equilibrium binding affinities (pKB) of the PAMs, (C) the degree of binding modulation (α) between iperoxo (Ipx) and PAMs, and the modified affinities (D) α/KB. See Table 1. All data are mean ± SEM of three or more independent experiments performed in duplicate or triplicate with the pharmacological parameters determined from a global fit of the data. The error in (D) was propagated using the square root of the sum of the squares. *Indicates statistical significance (p<0.05) relative to WT as determined by a one-way ANOVA with a Dunnett’s post-hoc test.
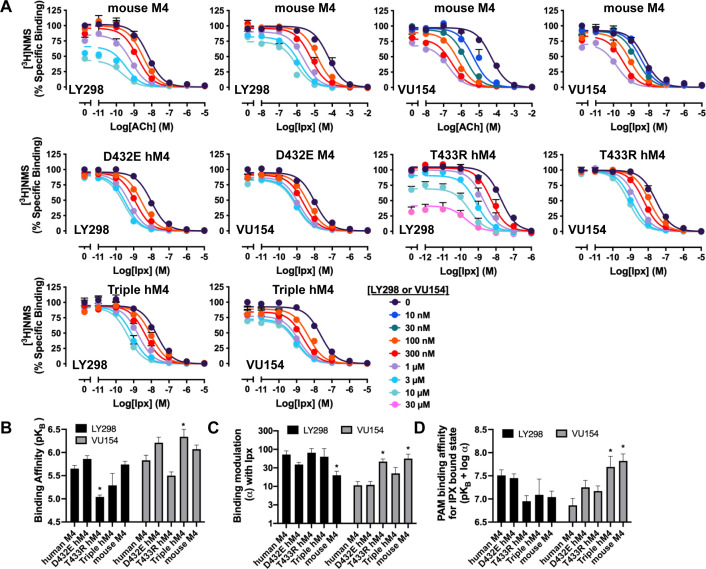
Figure 7—figure supplement 1—source data 1. Related to Figure 7—figure supplement 1.
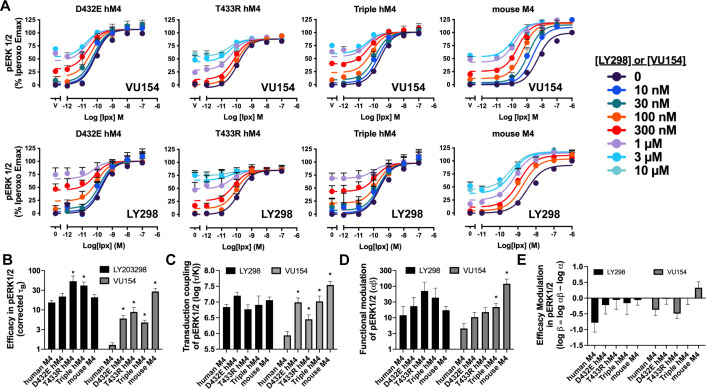
Figure 7—figure supplement 2. Functional parameters of the positive allosteric modulators (PAMs) at the human and mouse M4 muscarinic acetylcholine receptors (mAChRs) in pERK1/2 signaling assays.

Figure 7—figure supplement 2.

(A) Concentration–response curves of an interaction between iperoxo (Ipx) and the PAMS VU154 and LY298 in pERK1/2 at the mouse M4 mAChR, D432E, T433R, and the V91L, D432E, T433R triple mutant of the human M4 mAChR. (B–E) Quantification of data from (A) to calculate (B) the signaling efficacy (τA and τB) and (C) the transduction coupling coefficients (log (τ/K)) of each ligand, (D) the functional cooperativity (αβ) between ligands, and (E) the efficacy modulation (β) between ligands. See Table 1.
Figure 7—figure supplement 2—source data 1. Related to Figure 7—figure supplement 2.
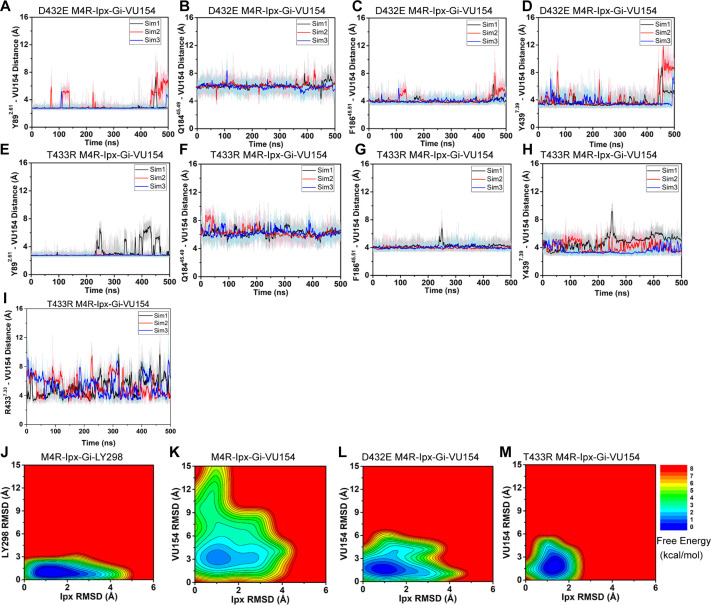
Figure 7—figure supplement 3. Gaussian accelerated molecular dynamics (GaMD) simulations of D432E and T433R human M4 muscarinic acetylcholine receptor (mAChR) mutants.

Figure 7—figure supplement 3.

(A–H) Time courses obtained from GaMD simulations of the (A–D) D432E and (E–H) T433R mutant M4R-Ipx-Gi1-VU154 systems with (A, E) Y892.61 – VU154 distance, (B, F) Q18445.49 – VU154 distance, (C, G) F18645.51 – VU154 distance, and (D, H) Y4397.39 – VU154 distance. with residues (A, E) Y897.39, (B, F) F18645.51, (C, G) Y4397.39, and (D, H) Q18445.49. (I) Distance between R4337.33 to the sulfoxide group of VU154 from GaMD simulations of the T433R M4R-Ipx-Gi1-VU154 mutant. (J–M) 2D free energy profile of the root mean square deviations (RMSDs) of LY298 and VU154 with Ipx. See Table 3.