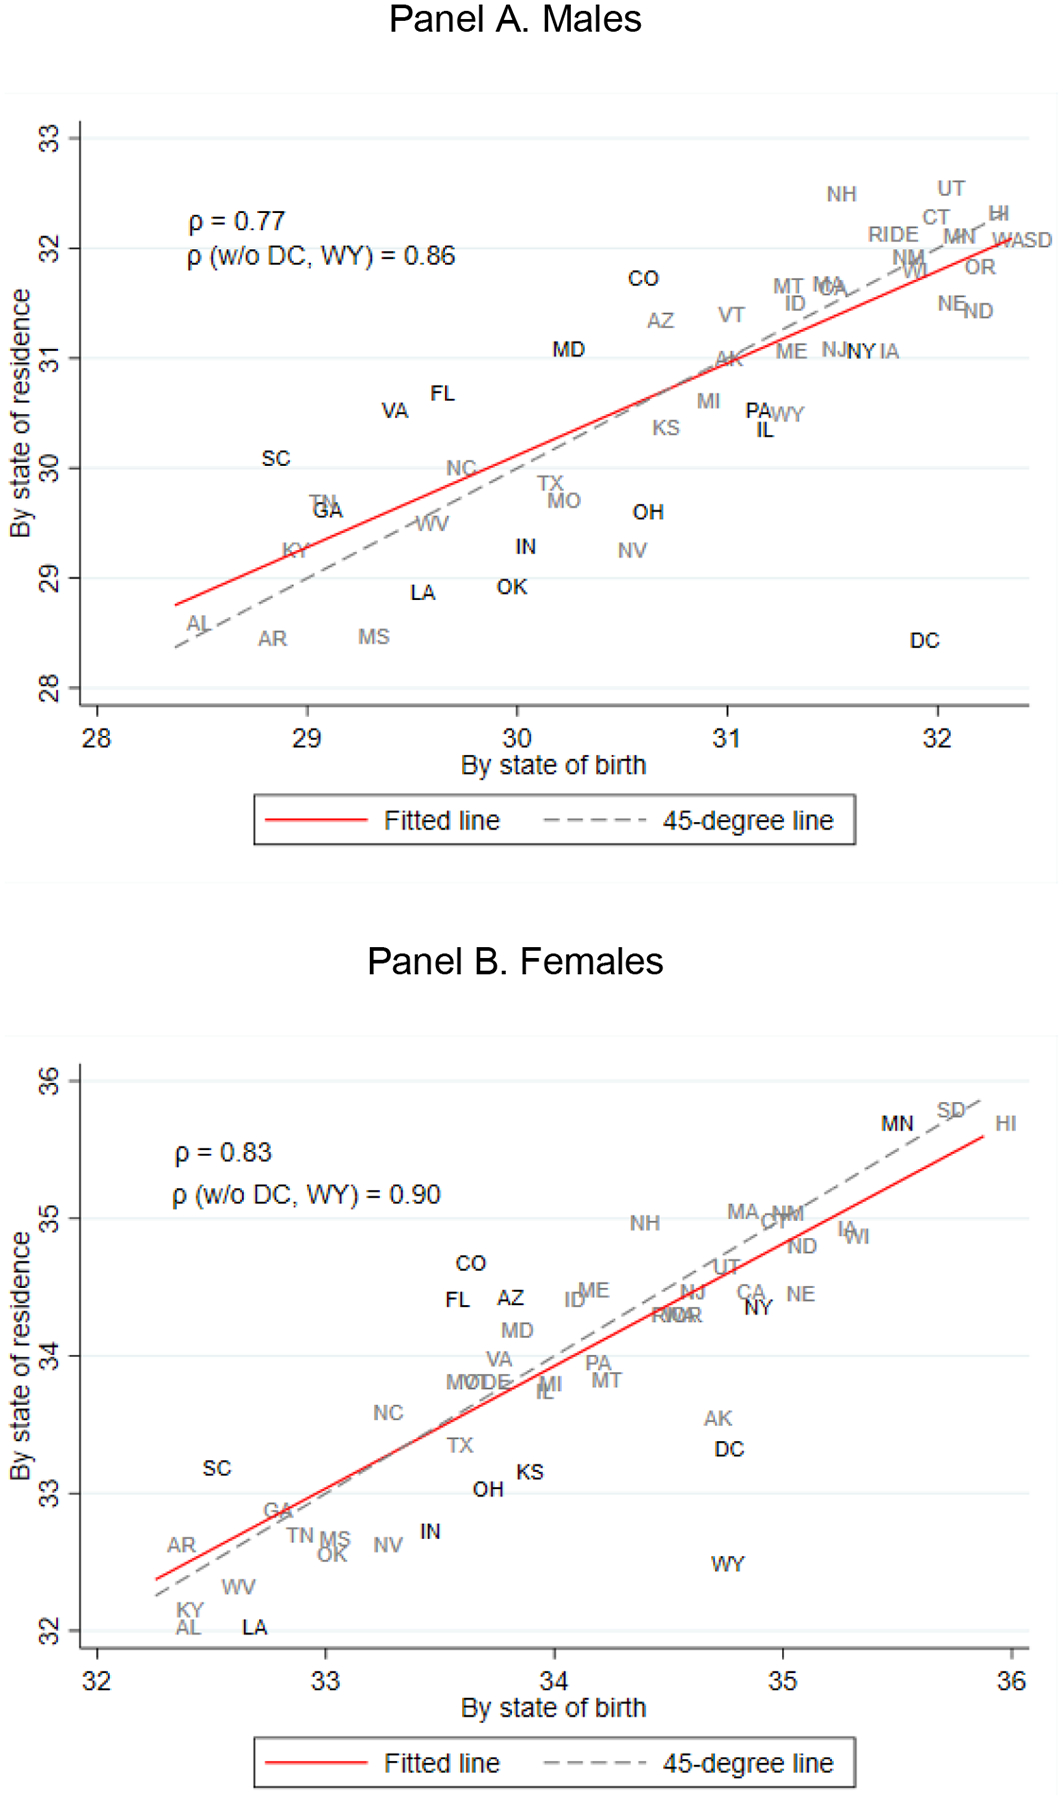
Figure 1:

Life expectancies at age 50 by state of birth and state of residence
Note: Figure 1 shows the relationship between life expectancy at age 50 by state of birth and state of residence separately by gender. Life expectancies were constructed using data disclosed from the MDAC dataset with Census disclosure numbers CBDRB-FY19–304 and CBDRB-FY20–092, using the methods explained in the paper and further detailed in Technical Appendix A. Panel A shows the relationship between the two alternative measures of life expectancy at age 50 for men. Panel B shows the same relationship for women. States that have a significant difference between life expectancy measures at the 10% level are marked in black. The rest of the states are shown in gray.
