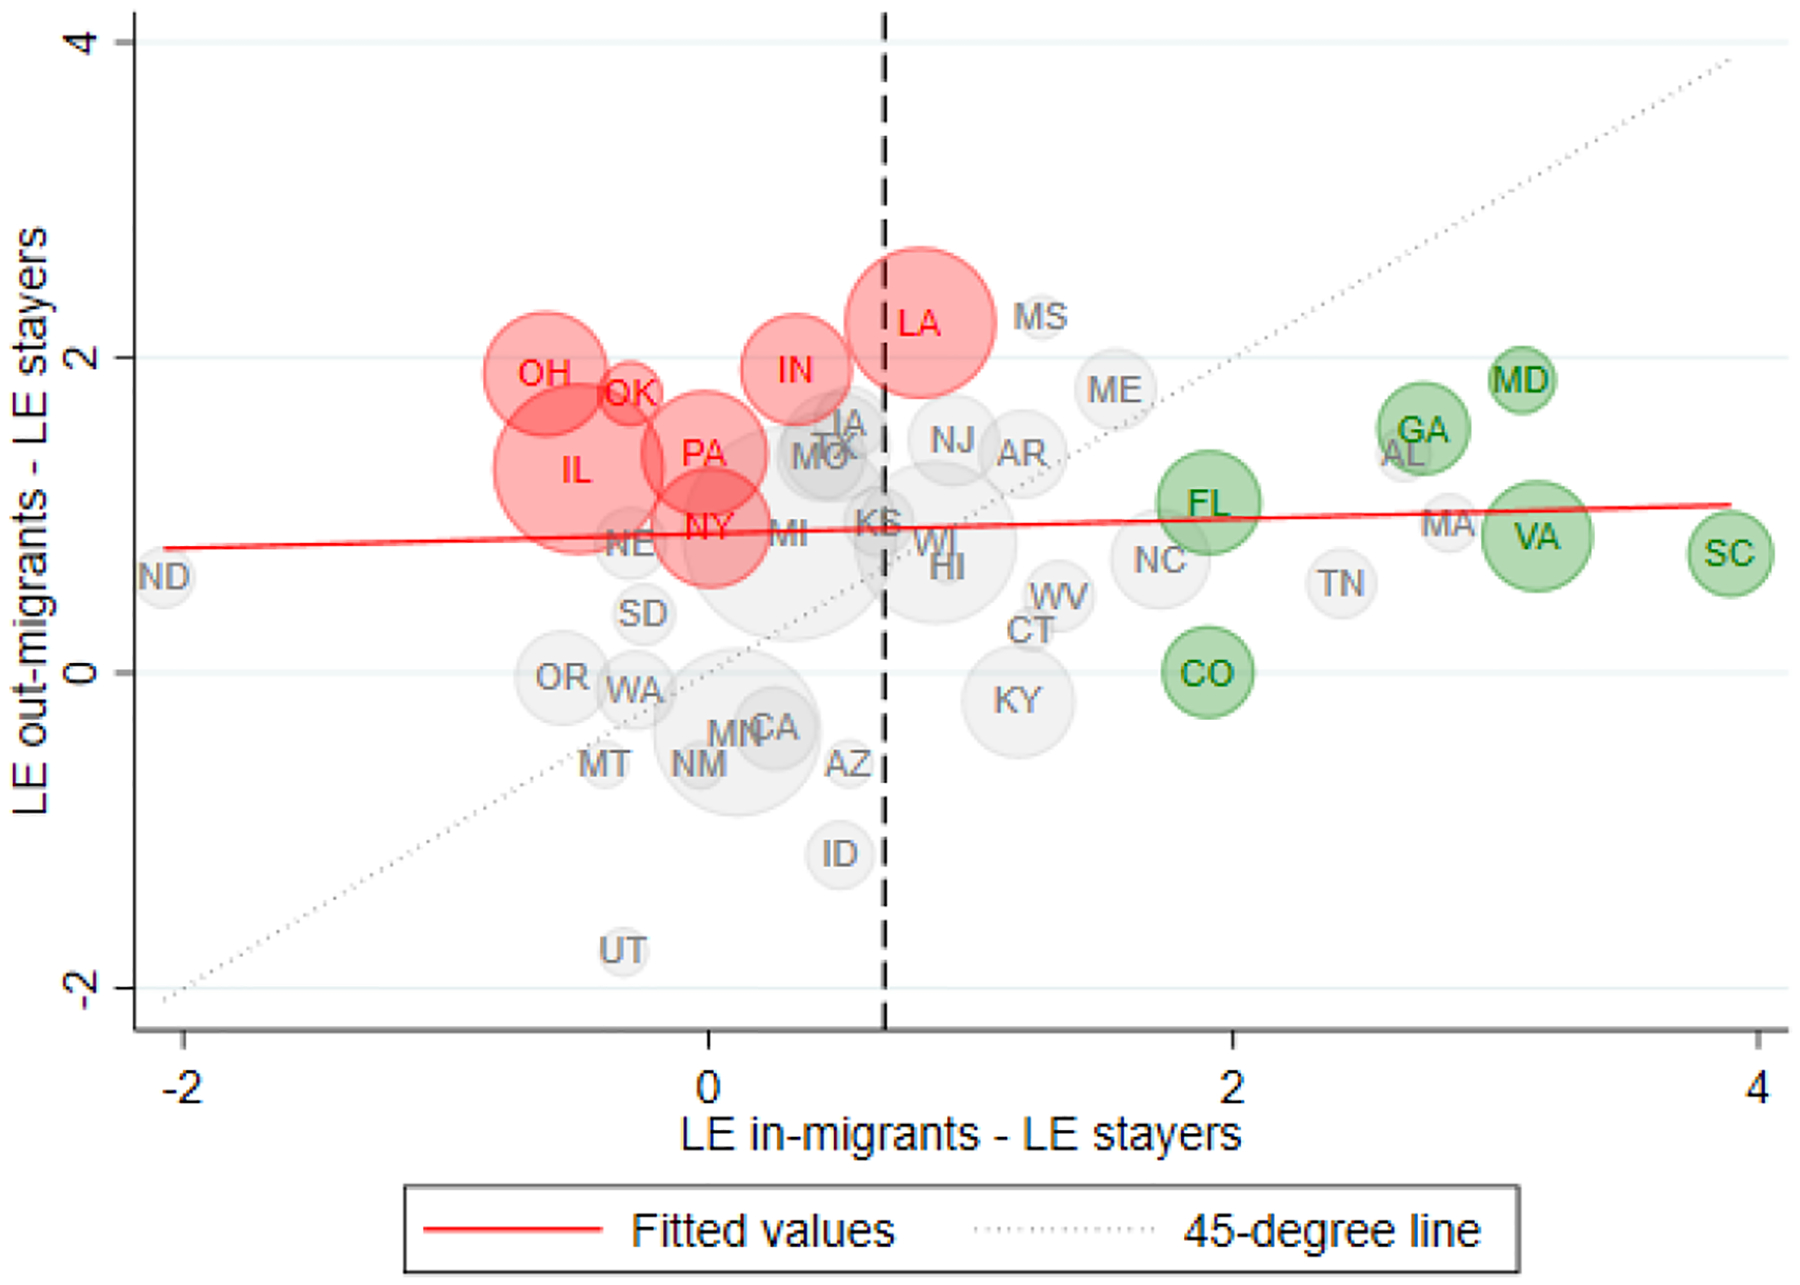
Figure 4:

Relationship between the relative mortality advantage of out-migrants and the relative mortality advantage of in-migrants across states
Note: Figure 4 shows the difference in male life expectancy at age 50 of in-migrants relative to stayers on the horizontal axis and the difference in male life expectancy at age 50 of out-migrants relative to stayers on the vertical axis. States are weighted by the inverse variance of the difference between the life expectancy by state of residence and life expectancy by state of birth. States in green (red) have a male life expectancy at age 50 by state of residence that is significantly higher (lower) than the equivalent life expectancy by state of birth. The red dashed line corresponds to the fitted line of the weighted regression at the state level. The line in black corresponds to the weighted mean of the relative advantage of out-migrants (0.69 years).
