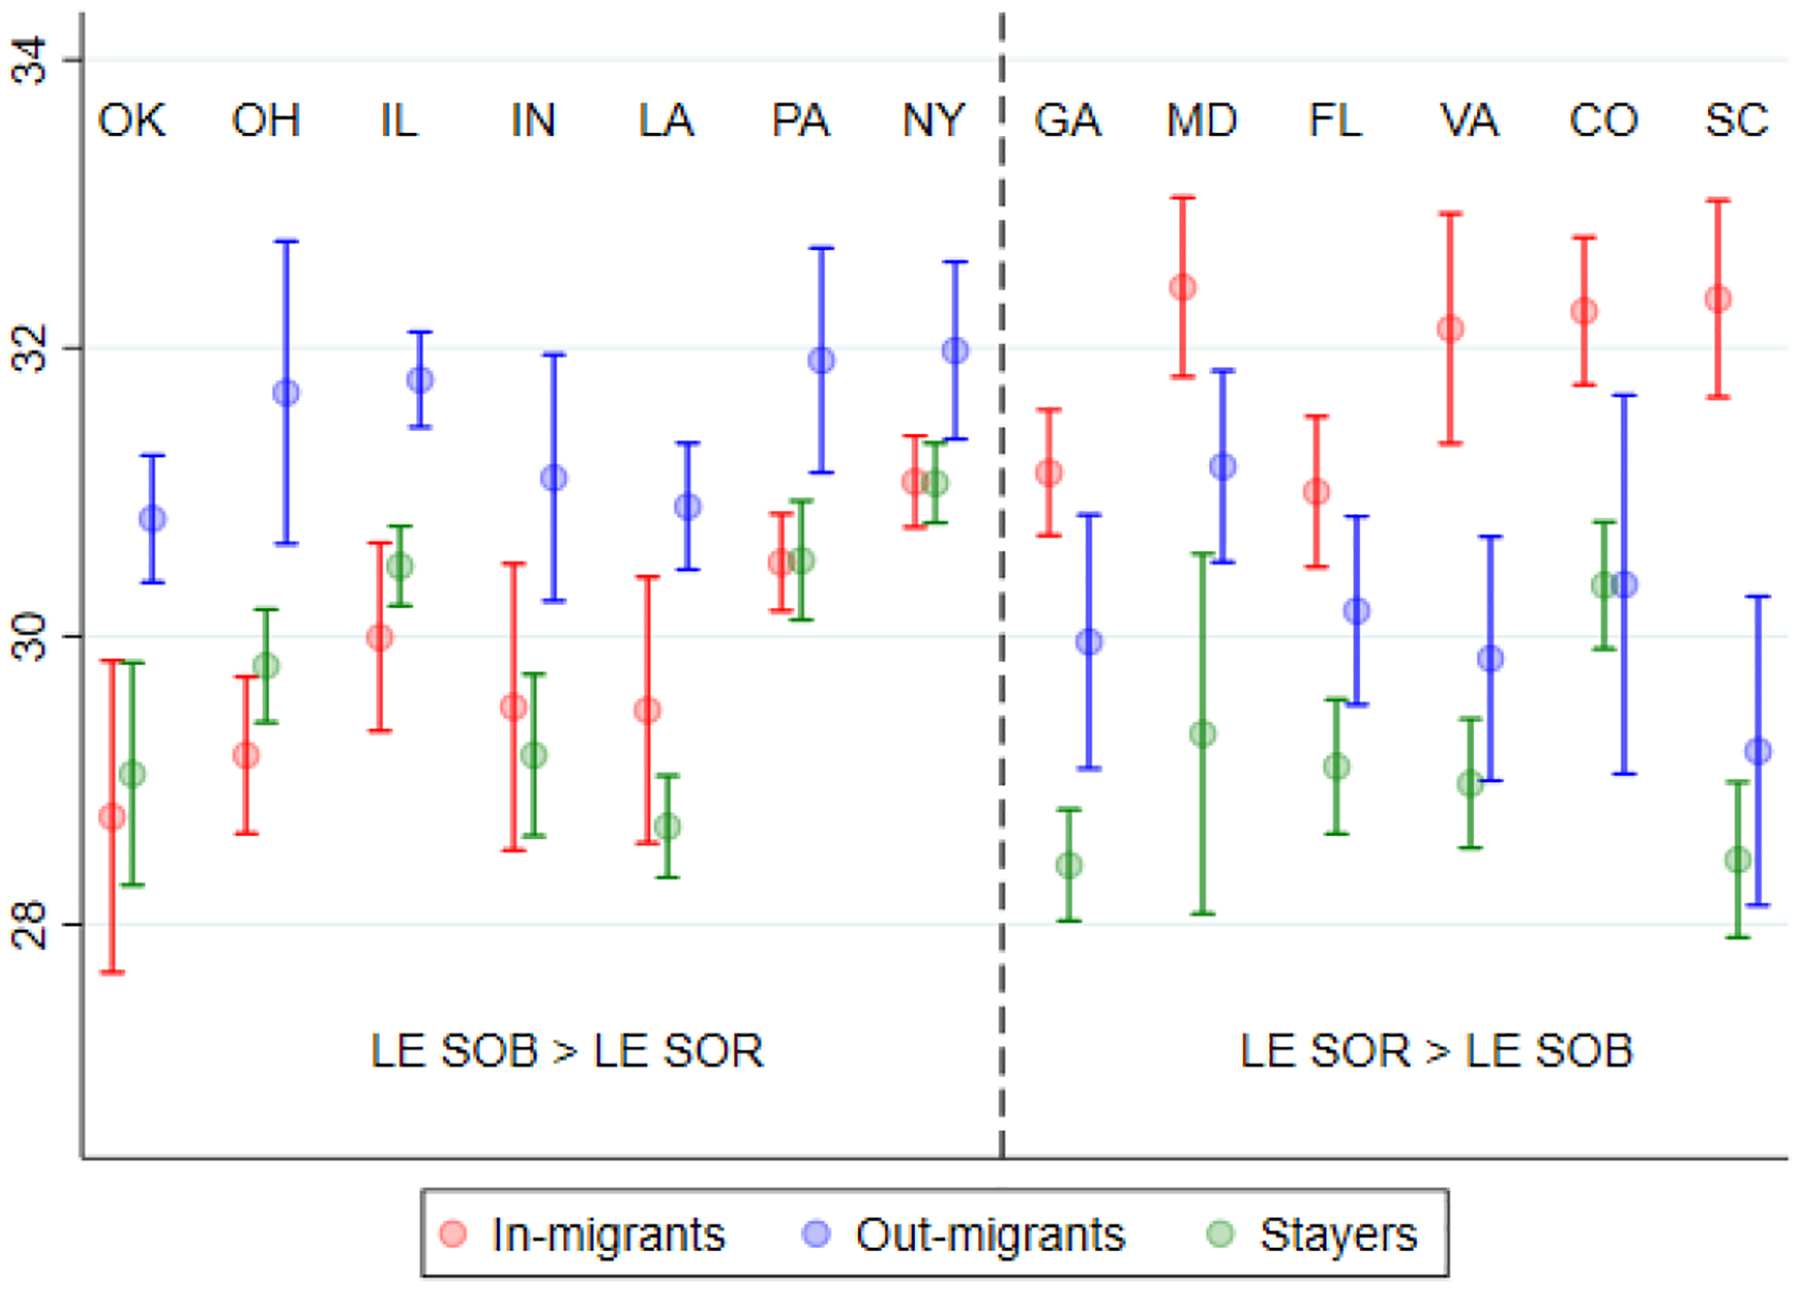
Figure 5:

Male life expectancies of stayers, movers-in, and movers-out at age 50 in selected states
Note: Figure 5 shows the male life expectancy at age 50 for stayers, in-migrants, and out-migrants in the 13 states where the difference in life expectancy by state of residence and state of birth is statistically significant at conventional levels. Point estimates and 95% confidence intervals of the life expectancy of each type of individual in each state are also included.
