
Figure 6:
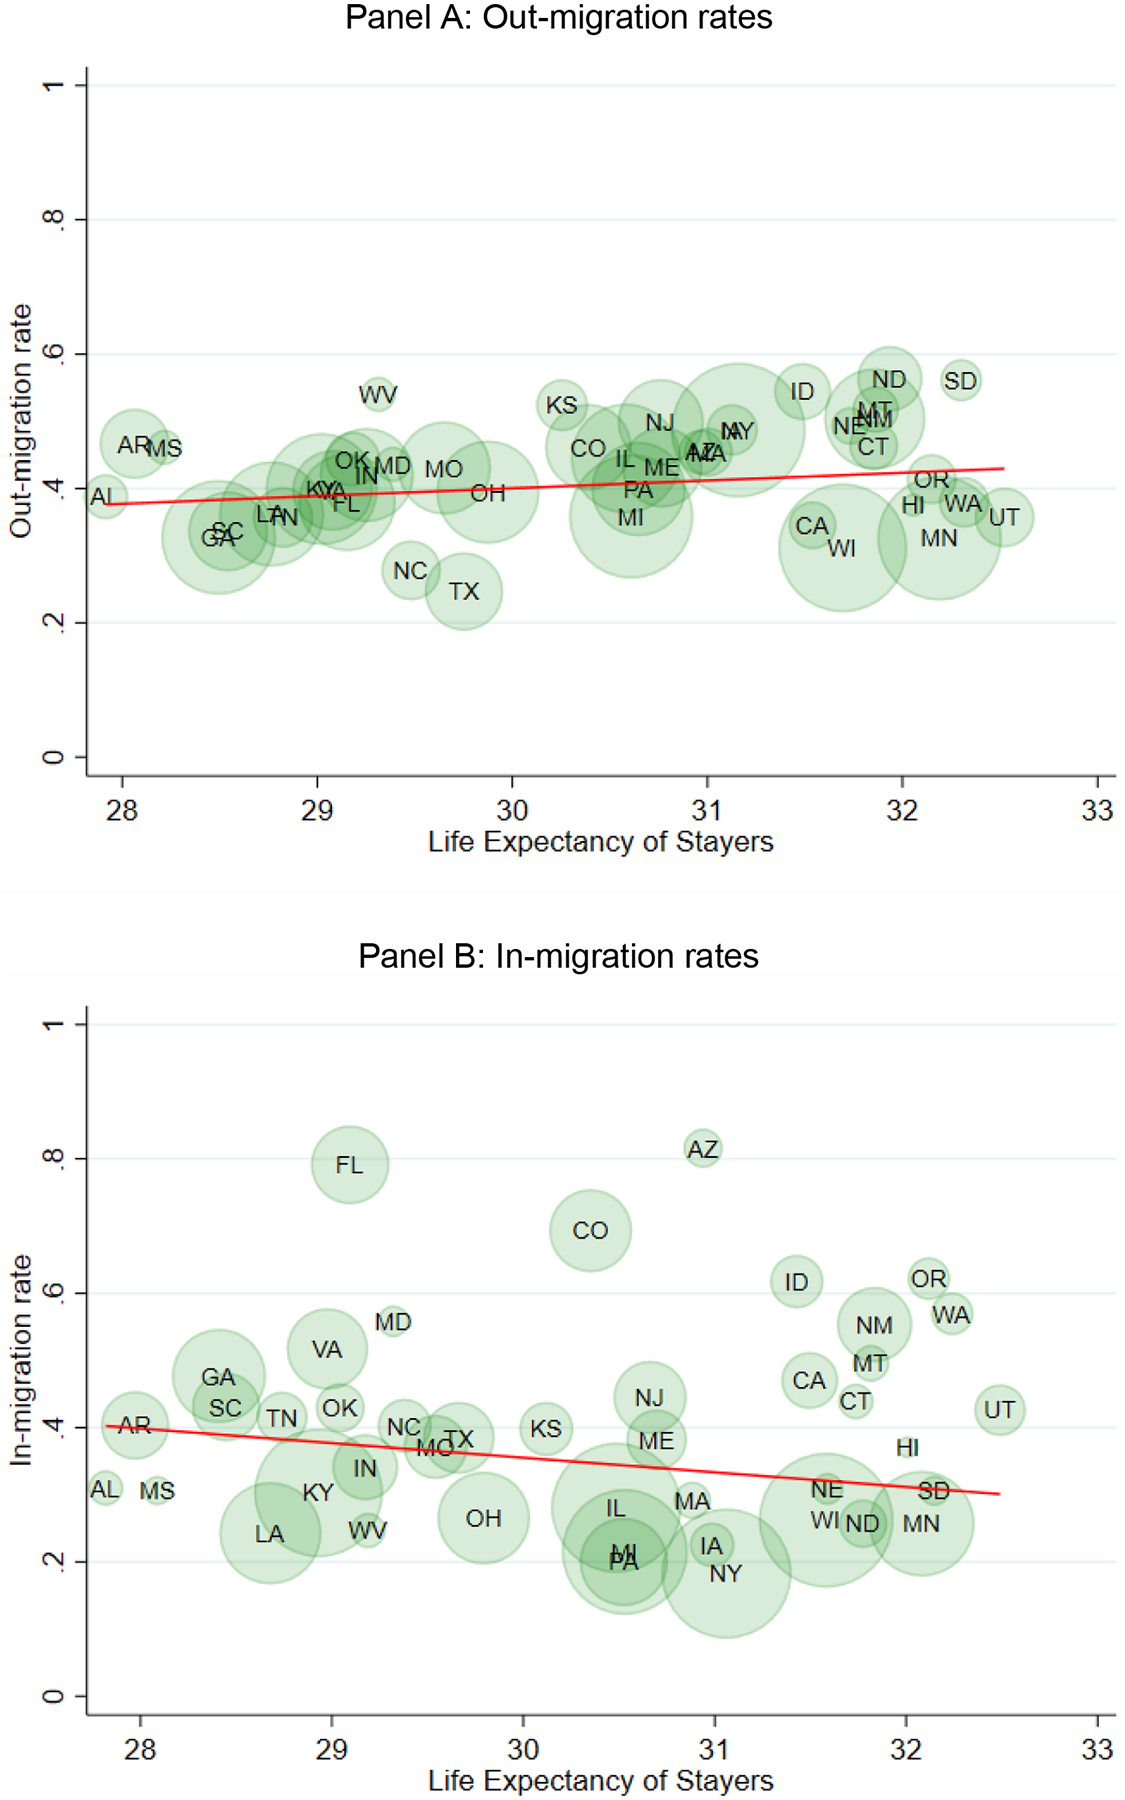
Relationship between life expectancy of male stayers at age 50 and migration rates
Note: Panel A (B) of Figure 6 shows the relationship between male life expectancy of the stayer sub-population at age 50 and out-migration (in-migration) rates at the state level. The out-migration rate of state is calculated as the proportion of 50–64 year-old men that were born in state that are out of their state of birth by the time of the 2008 ACS interview. Similarly, the in-migration rate of state is calculated as the proportion of 50–64 year-old men that are observed in by the time of the ACS interview that were born in a different state. In both panels, states are weighted by the inverse variance of the male life expectancy of stayers at age 50.