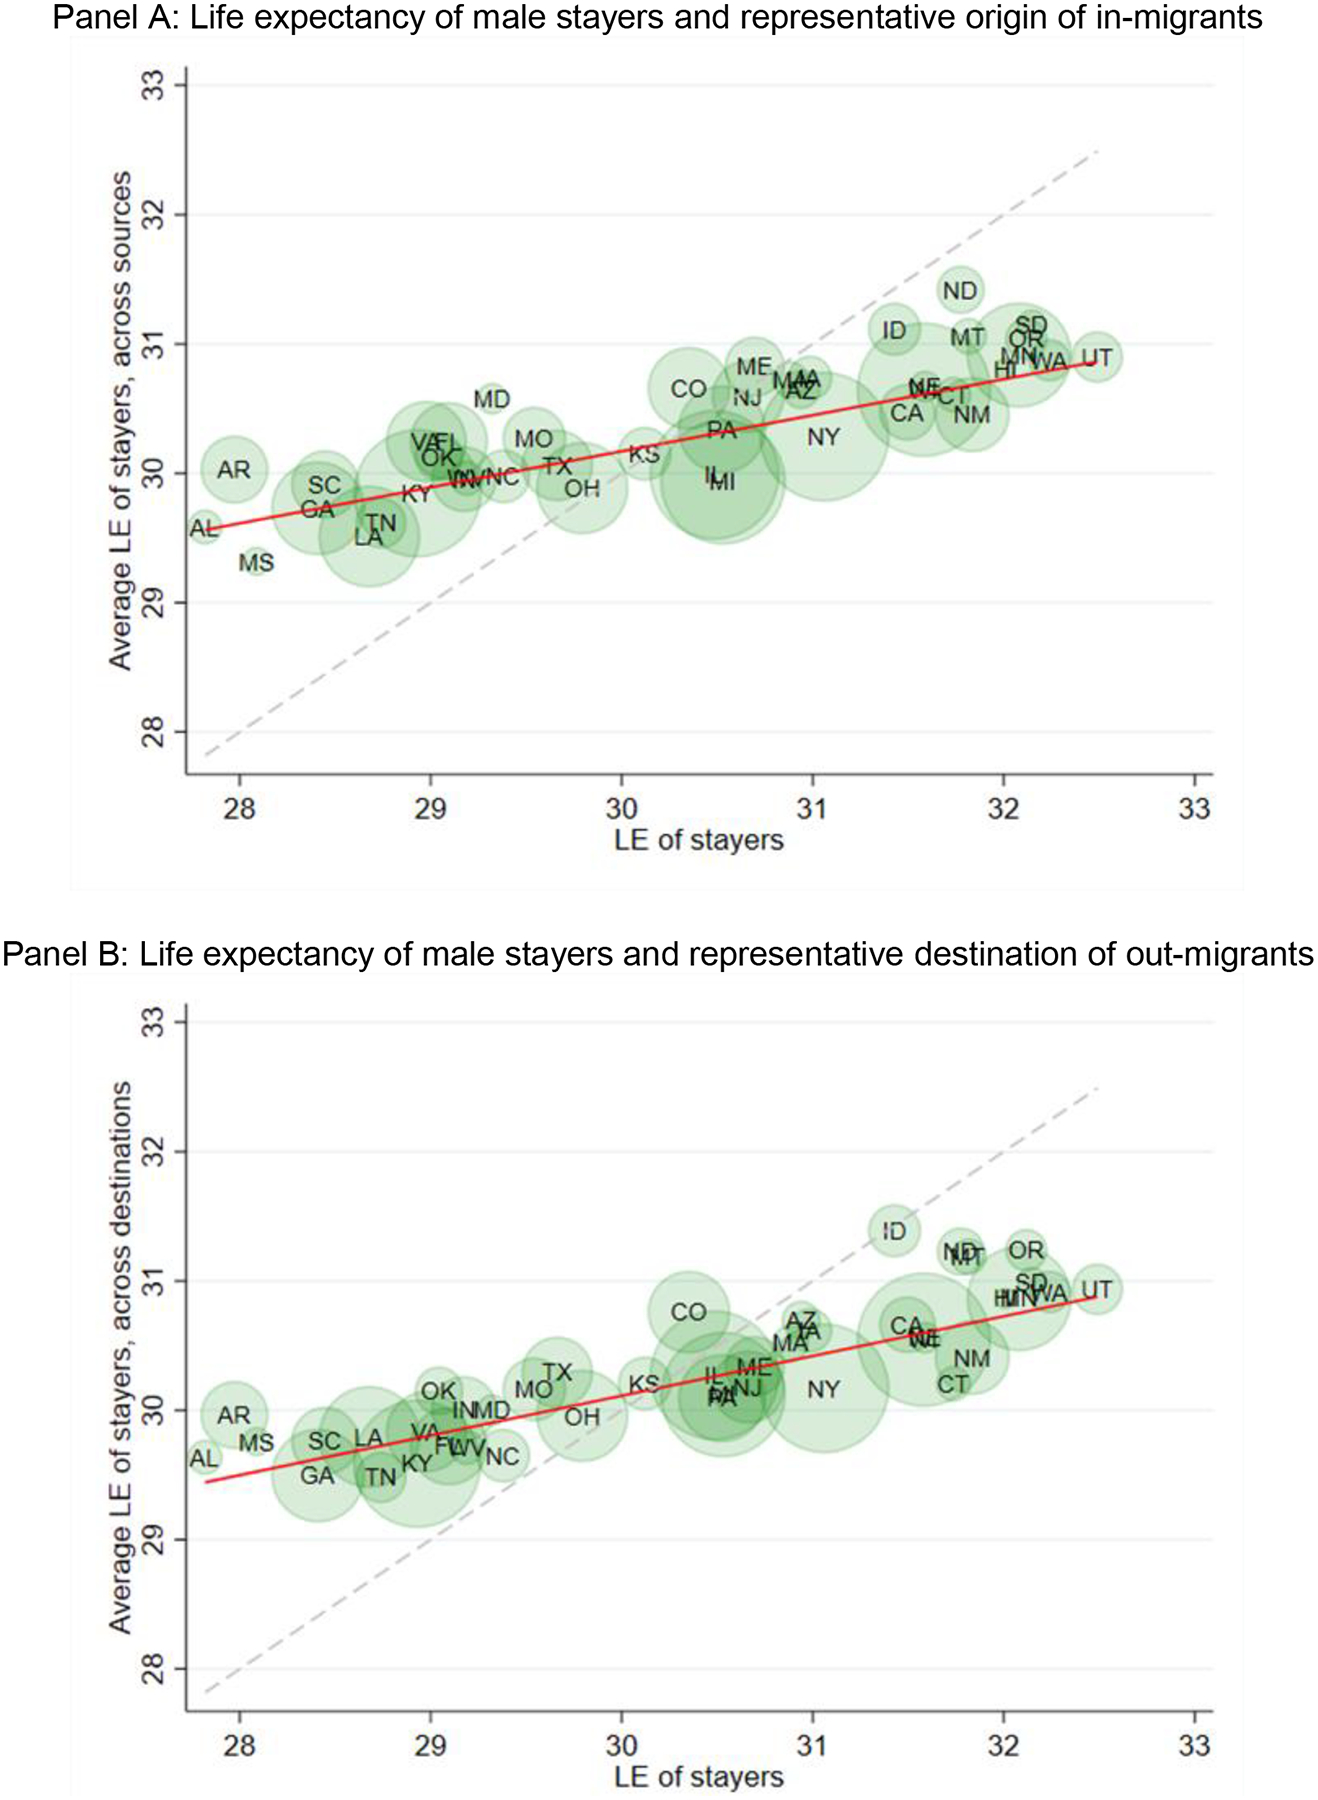
Figure 7:

Relationship between male life expectancy of stayers at age 50 and representative origin / destination states
Note: Panel A (B) of Figure 7 shows the relationship between the life expectancy of stayers and a measure that proxies for the place effect of the representative source (destination) of in-migrants (out-migrants). For more details on the construction of the proxies see the main text. In both panels, states are weighted by the inverse variance of the male life expectancy of stayers at age 50.
