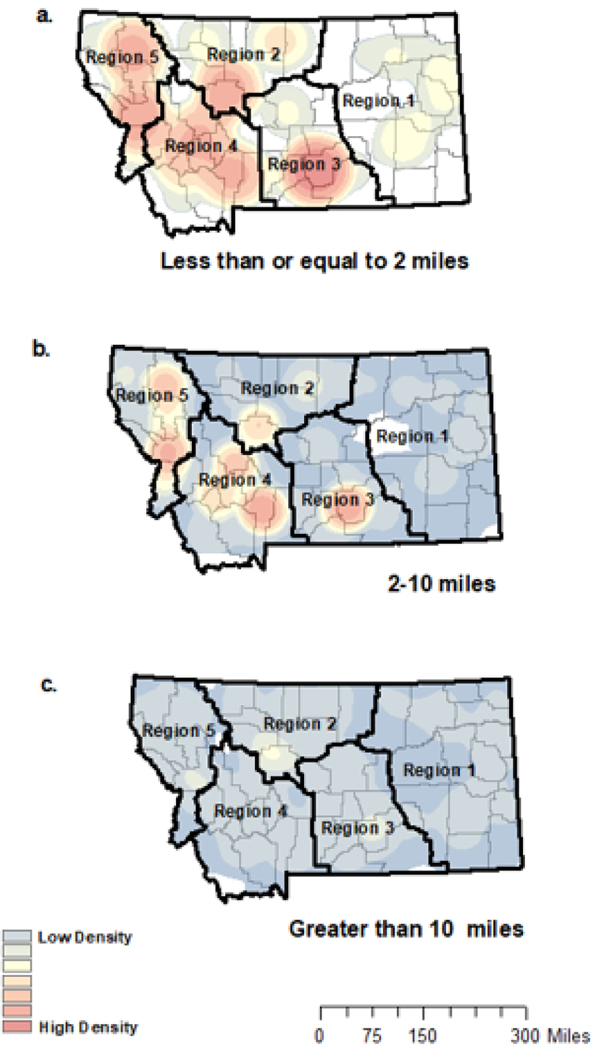
Figure 1.
Density of geomasked locations of children born between 2015–2017 in Montana by distance to immunization provider
Each heat map represents the density of geomasked location of children born 2015–2017 in Montana is presented by driving distance to immunization provider. Maps were created using kernel density estimation (100km search radius). Figure 1a depicts density of children who live short distance (<2 road miles) from the nearest immunization provider. Figure 1b depicts density of children who live medium distances (>2–10 road miles) from the nearest provider. Figure 1c depicts density of children who live long distances (>10 road miles) from the nearest provider. Colors represent equal parameters across maps. County borders are outlined and “region” indicates the different Montana Health Planning Regions.

