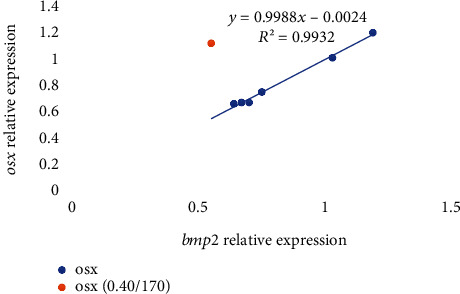
Figure 2.

Relative expression of osx in relation to bmp2 expression in gilthead seabream larvae fed diets supplemented with several levels of vitamin D3 and vitamin K3 for 21 days (n = 3, p < 0.05; blue dots for values of diets 0.00/0, 0.06/70, 0.06/170, 0.13/70, 0.13/170, and 0.40/70 and orange dot for 0.40/170).
