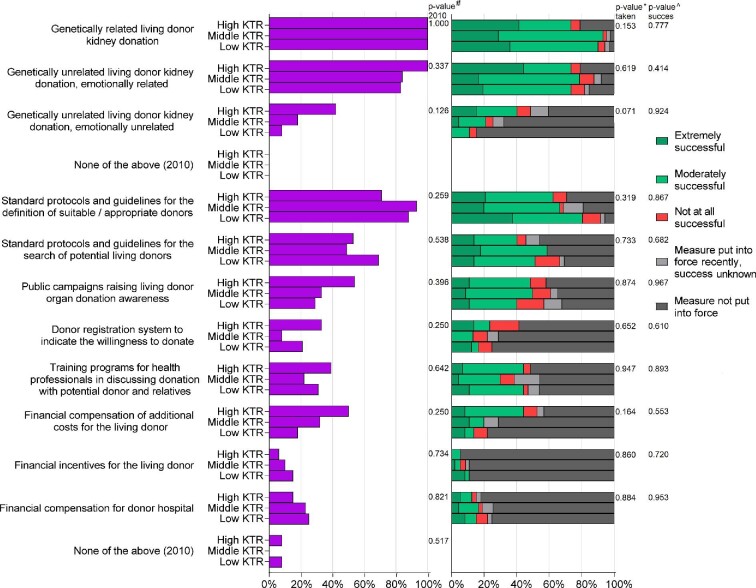
Figure 5:
Measures in force in 2010 (left panel) and measures put into force (right panel) on the donation level to increase the living donor KT rate between 2010 and 2018, by KT rate group. The Pearson's chi-squared test was used to test for differences between KT rate groups in the percentage of countries for which a measure was in force in 2010 (#P-value 2010), a measure was taken during the study period (*P-value taken) and a measure in force was rated as successful (^P-value success).

