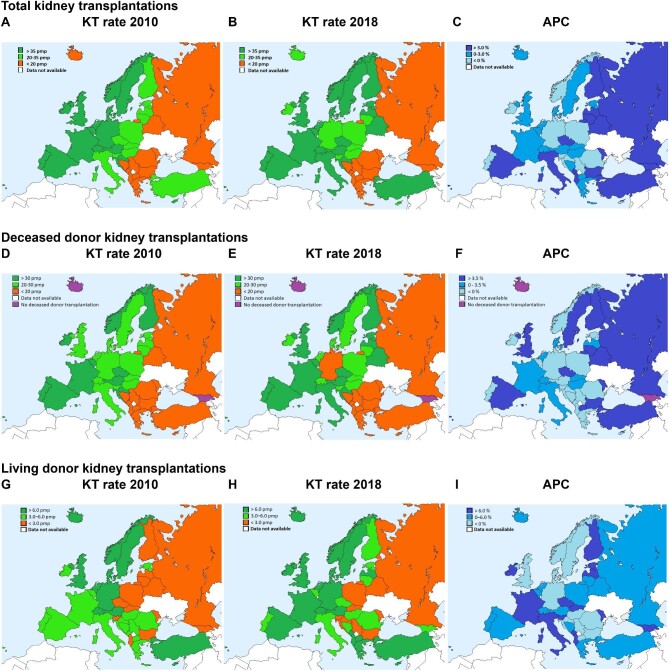
Figure 2:
KT rate p.m.p. in 2010 and 2018 and the average APC per donor type. (A) Total KT rate in 2010 p.m.p. (B) Total KT rate in 2018 p.m.p. (C) The APC between 2010 and 2018 with zero joinpoints (i.e. one trend for the entire study period) for the total KT rate. (D) DD-KT rate in 2010 p.m.p. (E) DD-KT rate in 2018 p.m.p. (F) The APC between 2010 and 2018 with zero joinpoints (i.e. one trend for the entire study period) for the DD-KT rate. (G) LD-KT rate in 2010 p.m.p. (H) LD-KT rate in 2018 p.m.p. (I) The APC between 2010 and 2018 with zero joinpoints (i.e. one trend for the entire study period) for the LD-KT rate.

