. 2023 May 24;31(3):333–343. doi: 10.32604/or.2023.028694

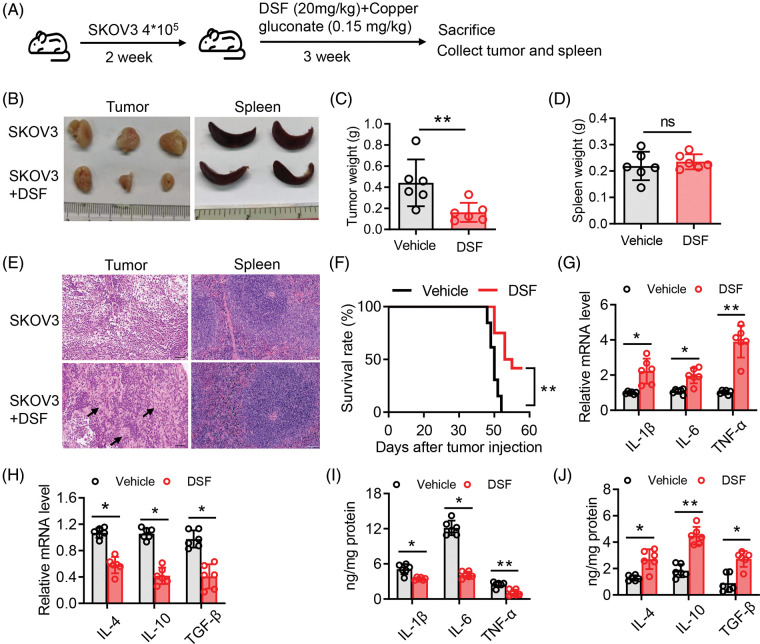
Figure 2. DSF suppressed tumor growth in an ovarian tumor xenograft mouse model. (A) Schematic depicting the treatment of the SKOV-3 cell-based tumor-bearing mouse model for assessing the anti-cancer effect of DSF. DSF (20 mg kg−1, suspended in 0.5% NaCMC), gluconate (0.15 mg kg−1), and vehicle (equal volume of 0.5% NaCMC)-treated mice after SKOV-3 ovarian cancer cell inoculation (n = 5 mice per group). (B) Photographs of xenograft tumors and spleens from NOD/SCID mice injected with SKOV-3 cells at day 30. (C and D) Quantitative analysis of the weights of tumors (C) and spleens (D) from mice treated with the vehicle or DSF. (E) H&E staining of tumor and spleen from mice treated with the vehicle or DSF. Scale bar, 100 μm. (F) Survival rate of tumor-bearing mice after treatment with vehicle or DSF. (G) The mRNA expression levels of IL-1β, IL-6 and TNF-α isolated from tumors in mouse administrated with vehicle or DSF (20 mg kg−1) at day 30 after ovary inoculation. (H) The mRNA expression levels of IL-4, IL-10 and TGF-βfrom tumors in mice treated with vehicle or DSF (20 mg kg−1) at day 30 after SKOV-3 cell inoculation. (I) ELISA data of IL-1β, IL-6 and TNF-α isolated from tumors in mouse administrated with Vehicle or DSF (20 mg kg−1) at day 30 after ovary inoculation. (J) ELISA data of IL-4, IL-10 and TGF-β isolated from tumors in mouse administrated with Vehicle or DSF (20 mg kg−1) at day 30 after ovary inoculation. Data in all panels are representative of at least three ((C–J) n = 5, mean ± SD) independent experiments. *p < 0.05; **p < 0.01 (unpaired t tests for measurements between the two groups in (C) and (D). Two-way ANOVA was used in (G–J) and log-rank (Mantel-Cox) test was used in (F)).

Figure 2