. 2023 May 24;31(3):275–286. doi: 10.32604/or.2023.028227

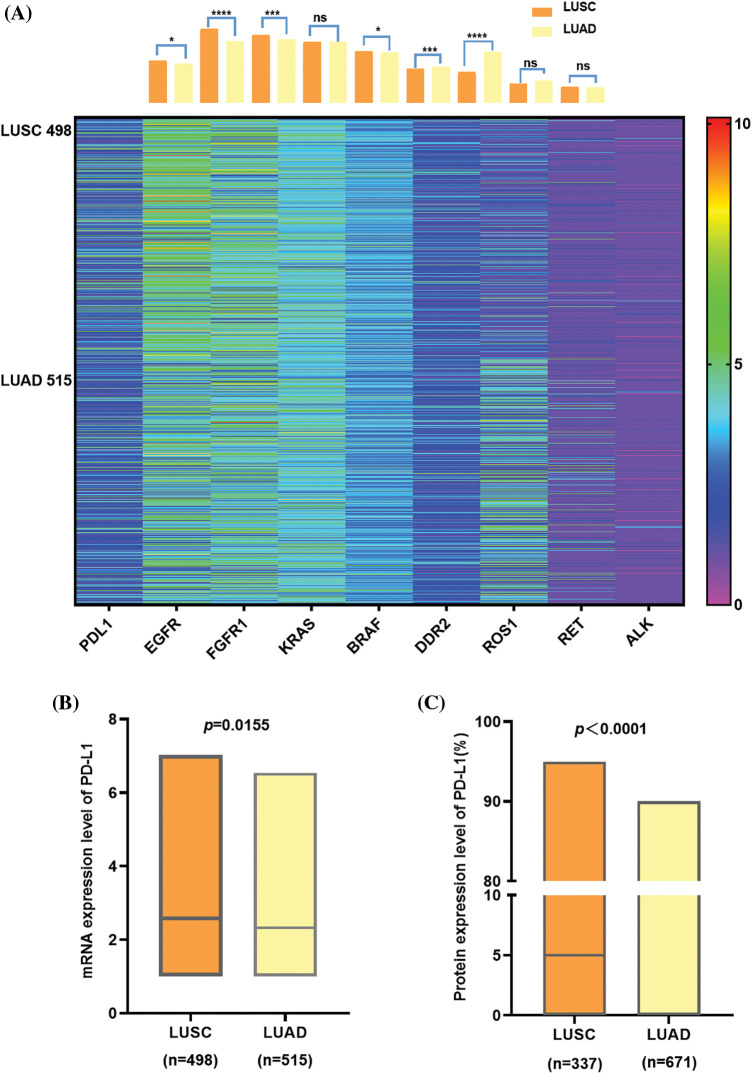
Figure 2. The comparison between LUSC and LUAD in lung cancer driver gene, PD-L1 expression at mRNA, and protein. (A) shows a heat map with a column bar of the lung cancer driver gene expression of NSCLC patients from the TCGA database. There is an apparent difference in the gene variation status of EGFR, ROS-1 (p < 0.0001), FGFR, and DDR2 (p < 0.001) between LUAD and LUSC, while on KRAS, RET, and ALK, obvious discrepancies do not exist. Regarding PD-L1, although the expression level is not very high in general, there are still divergences between the two subtypes. (B) At the mRNA level, PD-L1 expression was higher in LUSC than in LUAD, and it was the same at the protein level (C) In addition, PD-L1 protein tends to be 0 in LUAD since the median was zero.

Figure 2