FIGURE 2.

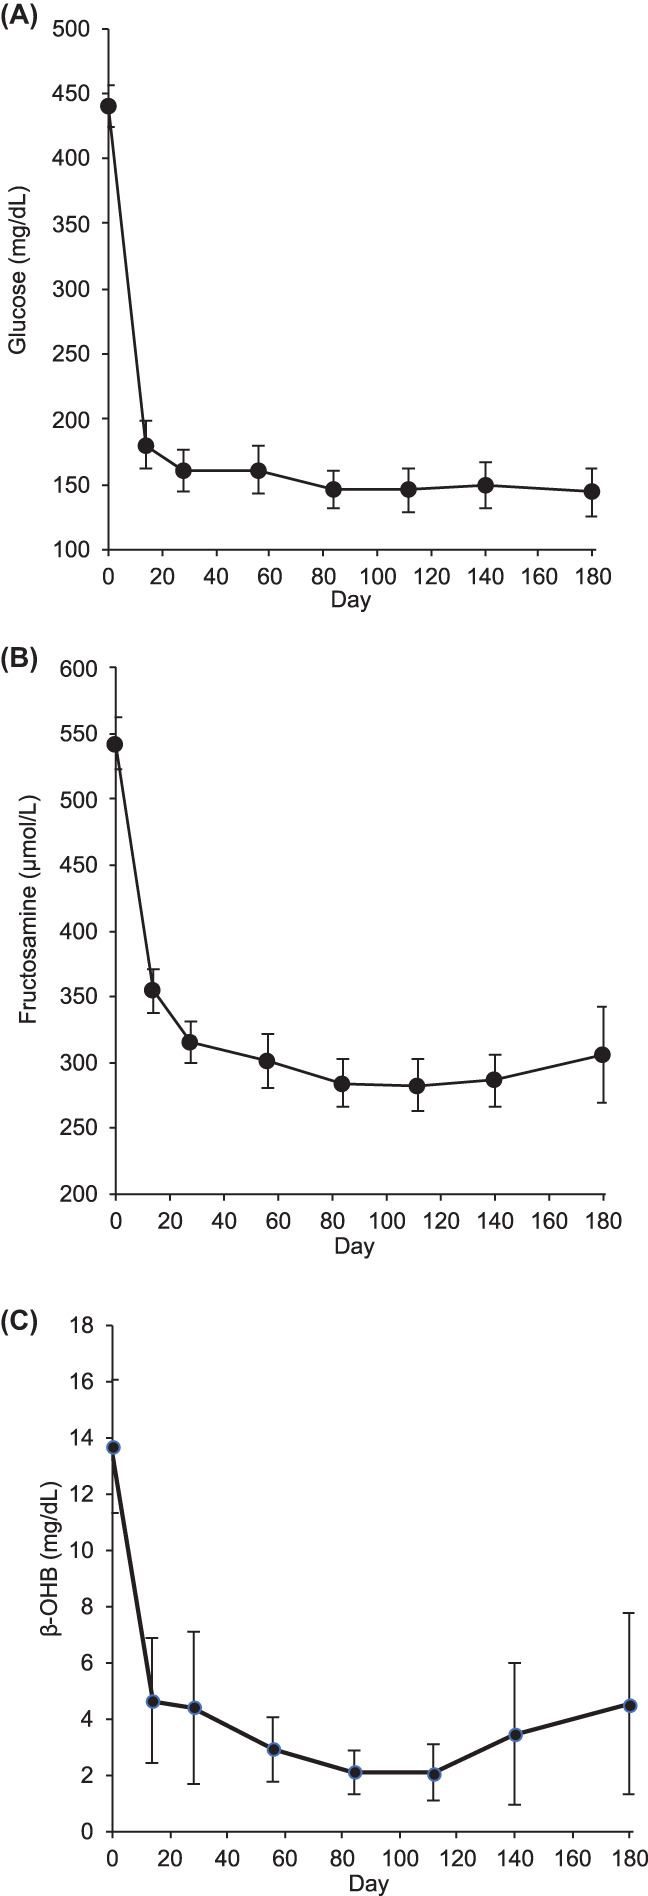
Serum glucose (A), fructosamine (B), and β‐hydroxybutyrate (β‐OHB) (C) as a function of time, plotted as means ± 95% confidence intervals.

Serum glucose (A), fructosamine (B), and β‐hydroxybutyrate (β‐OHB) (C) as a function of time, plotted as means ± 95% confidence intervals.