FIGURE 2.

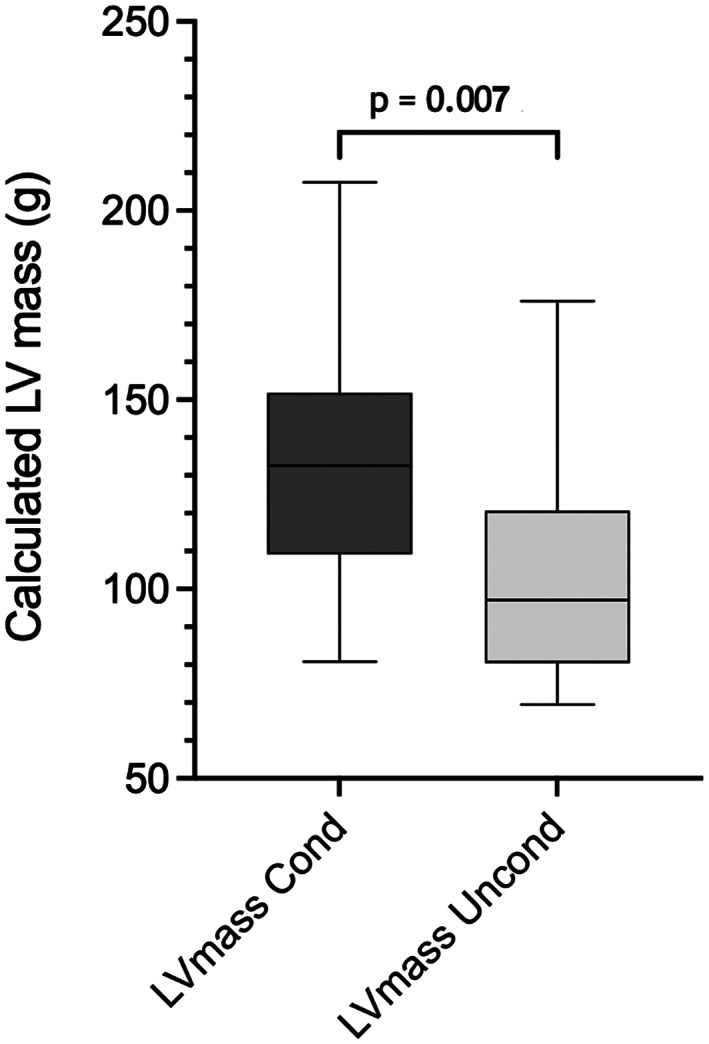
Box and whiskers plot comparing calculated left ventricular mass between “conditioned” (Cond, n = 25) and “unconditioned” (Uncond, n = 16) dogs (Students t test, P < .05). Line: median value, box: 25th and 75th percentile, whiskers: range.

Box and whiskers plot comparing calculated left ventricular mass between “conditioned” (Cond, n = 25) and “unconditioned” (Uncond, n = 16) dogs (Students t test, P < .05). Line: median value, box: 25th and 75th percentile, whiskers: range.