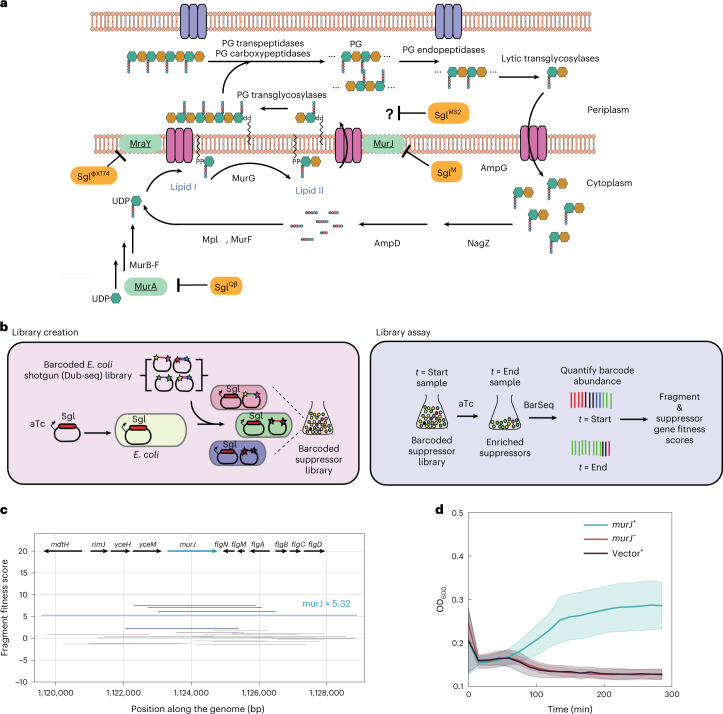
Fig. 1. Genome-wide screen to identify host suppressors of phage-encoded single-gene lysis systems.
a, Schematic representation of PG maturation and recycling in E. coli29. Three well-studied Sgl proteins (orange) are shown with their primary targets (green). The PG biosynthesis, translocation and regulation of PG maturation are reviewed in detail elsewhere28. b, Cartoon description of suppressor library creation and assay. A toxic gene (in this paper, an sgl gene) is cloned into an aTc-inducible vector. The Dub-seq library15 containing previously mapped dual-barcoded (shown as stars on the plasmid) random genomic fragments (shown as colored regions between stars) from BW25113 E. coli strain is transformed into the DH10B E. coli strain carrying the cloned sgl gene15, creating a barcoded suppressor library. Strains were tracked by quantifying the abundance of DNA barcodes associated with each strain by Illumina sequencing. Sgl-specific strain fitness profiles were calculated by taking the log2 fold change of barcode abundances between post- (t = End) and pre- (t = Start) induction of sgl and fragment and gene fitness scores calculated as described in Methods. c, Representative fragment and gene fitness data from our suppressor screening experiment for SglM. Dub-seq fragment (strain) data (y axis) for the genomic region (x axis) surrounding murJ under induction of SglM is shown. Each purple and gray line is a Dub-seq fragment. Those that completely cover murJ are shown in purple, and fragments that do not contain murJ or cover partially are colored gray. The murJ gene fitness score of 5.32, estimated using a regression model, is shown as a blue line (Methods)15. Multiple barcodes representing fragments containing MurJ were specifically enriched in our SglM screens. d, Growth curves show that heterologous expression of wild-type MurJ can suppress SglM lytic activity. Teal represents sglM and murJ co-overexpression using aTc and IPTG, respectively. Red represents sglM expression in the absence of murJ induction using aTc without IPTG. Black represents sglM expression in the presence of an empty ASKA vector using aTc and IPTG. All curves are plotted as mean of three (n = 3) independent biological replicates surrounded by the 95% confidence intervals.

