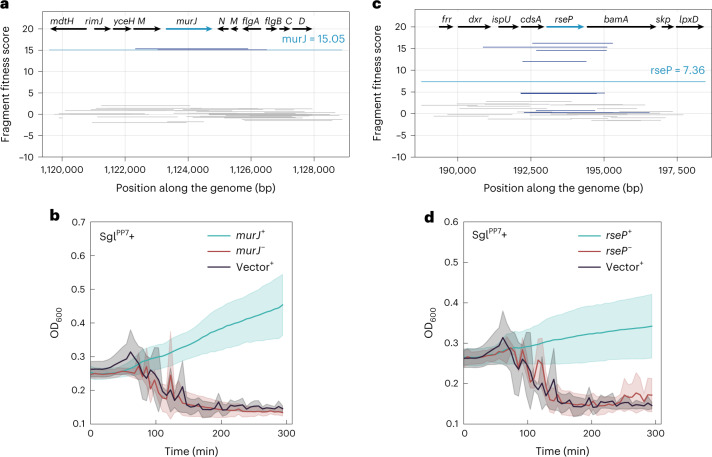
Fig. 3. Sampling of validated multicopy suppressors against Sgl protein expression.
a,b, Panels refer to suppressor activity of murJ expression against SglPP7-mediated lysis. c,d, Panels refer to suppressor activity of rseP expression against SglPP7-mediated lysis. Dub-seq fragment plots for the highlighted suppressor locus are shown in a and c. Dark blue lines correspond to fragments covering the gene of interest. Gray lines correspond to fragments not covering the gene of interest. Teal line corresponds to gene fitness score (Methods). b,d, Panels show lysis inhibition growth effects from a 96-well microplate reader assay. Multicopy suppressors or empty vector controls were expressed from the corresponding ASKA mutant collection plasmid under IPTG control. Teal curves correspond to suppressor induction at 50 µM IPTG. Black curves correspond to the empty ASKA vector negative control. Red curves correspond to the uninduced suppressor plasmid. All curves are plotted as mean of three (n = 3) independent biological replicates surrounded by the 95% confidence intervals. Large variations in optical density are caused by the aggregation of viscous cell debris observed in the course of the microplate reader experiment.

