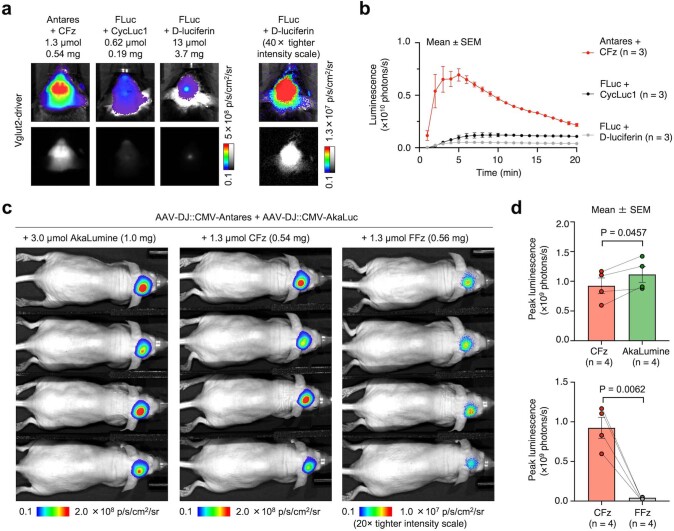
Extended Data Fig. 8. Additional comparisons between luciferase systems in the brain.
a-b, Comparison between Antares-CFz and FLuc-D-luciferin/CycLuc1 in Vglut2-driven luciferase-expressing reporter mice. a, Representative images with peak bioluminescence from each substrate injection. b, Bioluminescence intensity in the brain over time. Data are presented as mean values ± SEM. n = 3 animals in each group. c–e, Comparison between Antares-CFz/FFz and AkaLuc-AkaLumine pairs in the hippocampus of J:NU mice co-infected with AAV expressing Antares and AAV expressing AkaLuc. c, Representative images with peak bioluminescence from each substrate injection. d, Mean peak signal intensities. Data are presented as mean values ± SEM. P = 0.0457 between Antares-CFz and AkaLuc-AkaLumine and P = 0.0062 between Antares-CFz and Antares-FFz by two-tailed Student’s paired t-test. n = 4 animals in each group.

