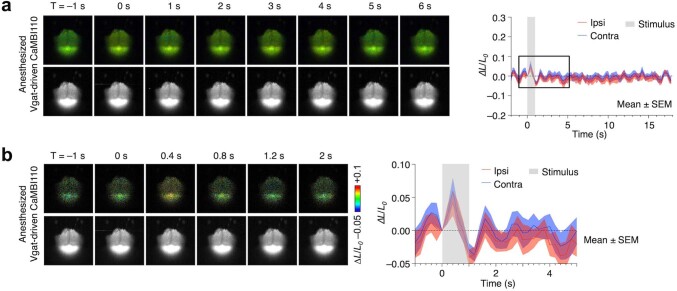
Extended Data Fig. 10. Orange CaMBI110 responses to vibrational stimulation in anesthesized mice.
a, Left, Representative frames of an image sequence averaged and normalized from 20 cycles of BLI after vibrational stimulus in anesthetized mouse doubly hemizygous for Vgat-cre and CAG-LSL-CaMBI110 transgenes. Top, pseudo-colored images; bottom, grayscale images. Right, normalized mean cortical bioluminescence. Gray box, the vibrational stimulus applied to the mouse’s hind paw. Shaded area, error bars showing s.e.m. b, Left, expanded time series within a shorter time interval surrounding the stimulus. Right, normalized mean traces from the boxed region in a. Traces in a–b are averages of 20 stimulation cycles.

