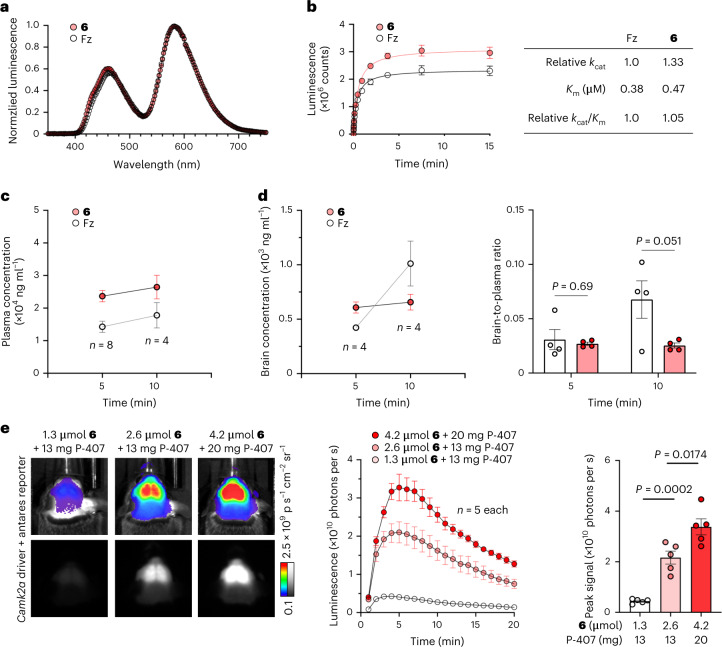
Fig. 2. Compound 6 enzymology, PK measurements and formulations.
a, Emission spectra of Antares when using Fz or compound 6 as substrate. b, Determination of kinetic parameters of relative kcat and absolute Km for Antares with each substrate. Data are presented as mean values ± s.d.; n = 3 technical replicates. Standard deviation was calculated to provide a measurement of the technical reliability of each measurement and not for the purposes of statistical comparison. c, Mouse plasma levels of Fz and compound 6 after i.p. administration of 1.3 µmol of either substrate. Data are presented as mean values ± s.e.m.; n = 8 animals for each compound at 5 min and n = 4 animals for each compound at 10 min. d, Brain concentration (left) and brain-to-plasma ratios (right) of each substrate. Data are presented as mean values ± s.e.m.; n = 4 animals for each compound at each time point. P values were determined by two-tailed Student’s unpaired t-test. e, Dose and vehicle optimization for compound 6 in mice doubly hemizygous for Camk2a-cre and CAG-LSL-Antares genes. Representative images at peak bioluminescence (left) and bioluminescence intensity over time (center) are shown. Data are presented as mean values ± s.e.m.; n = 4 animals in each condition. Statistical analysis of peak signals by two-tailed Student’s unpaired t-test is shown on the right; P = 0.0002 between 1.3 and 2.6 µmol, and P = 0.0174 between 2.6 and 4.2 µmol. Compound 6 is hereafter named CFz.

