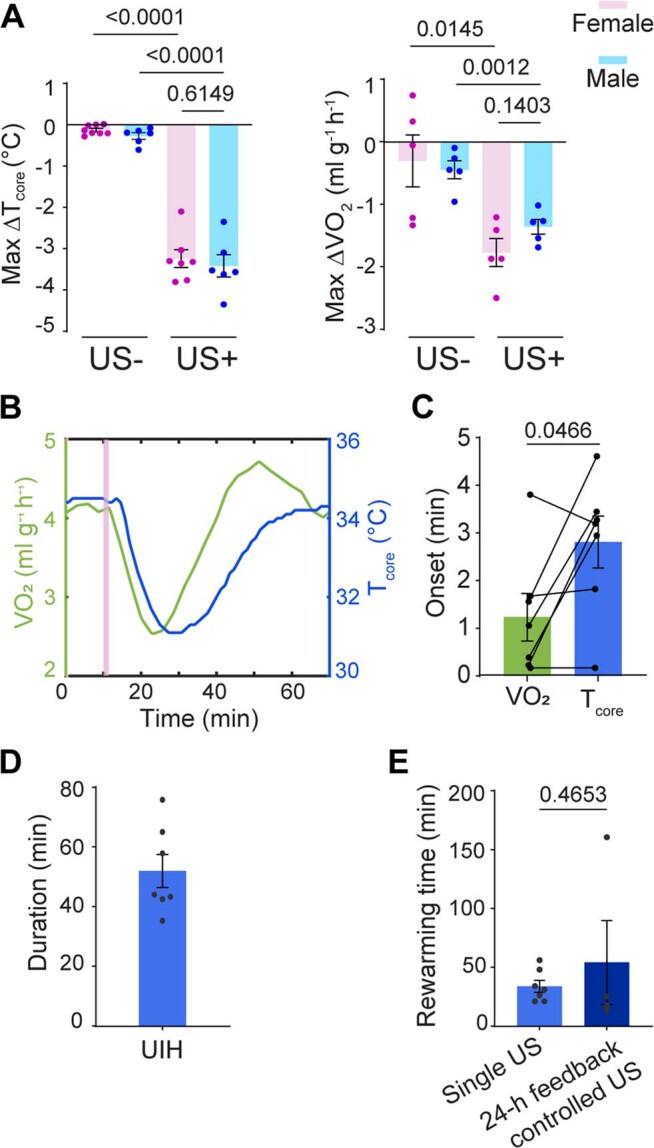
Extended Data Fig. 2. Characterization of the UIH.

(A) UIH-induced core body temperature change (max ΔTcore) and metabolic rate change (max ΔVO2) in female (pink) and male (blue) mice. In the left plot, n = 6 male mice in both US+ and US− groups and n = 7 female mice in US+ and 8 female mice in US− group. In the right plot, n = 5 mice in all groups. (B) Temporal correlation of VO2 and Tcore induced by ultrasound stimulation. US sonication is indicated by the pink bar. (C) Comparison of VO2 and Tcore onset time. N = 7 mice. (D) Quantification of the duration of the hypothermic state. N = 7 mice. (E) Quantification of the rewarming time (from the lowest Tcore to 34 °C) in groups receiving single US stimulation and receiving long-duration feedback-controlled ultrasound stimulation. N = 7 mice for the single US stimulation group and 4 mice for the feedback-controlled ultrasound stimulation group. Error bars denote s.e.m. Each dot represents one mouse. P values were calculated using an unpaired two-tailed t-test in (A and E) and a paired two-tailed t-test in C.
