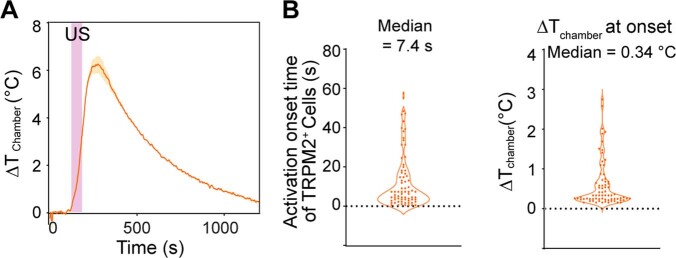
Extended Data Fig. 10. Measurements of the ultrasound-induced thermal effect in vitro.
(A) Temperature changes in the cell culture chamber (ΔTchamber) as a function of time. (B) (Left) The activation onset time of TRPM2+ cells was calculated from the fluorescence Ca2+ images of in vitro HEK293 cells with TRPM2 overexpression (Fig. 6). (Right) The corresponding ΔTchamber at the onset time of TRPM2 activation. Solid lines and shadows denote the mean ± s.e.m. Each dot represents one cell.

