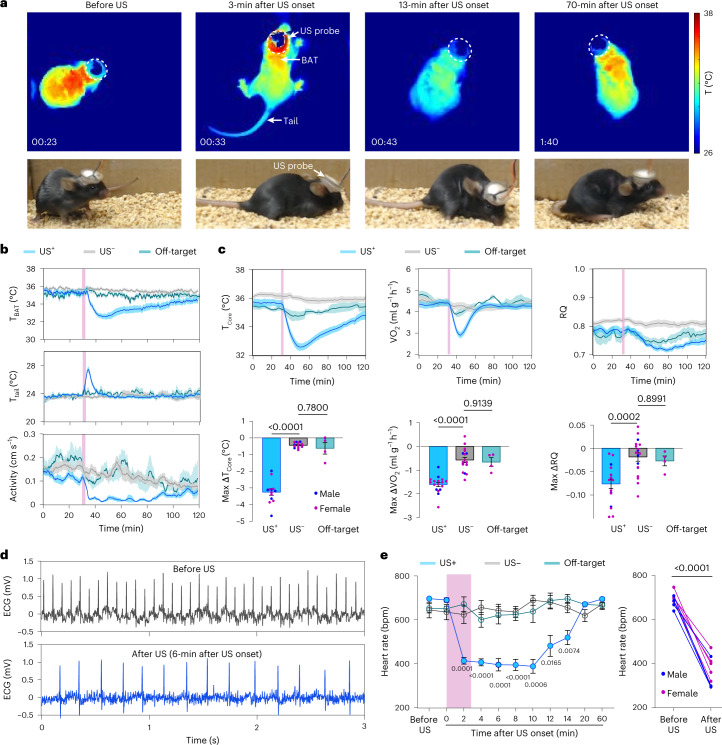
Fig. 2. Ultrasound stimulation of POA induces hypothermia and hypometabolism.
a, Infrared thermal images (top) and photos (bottom) of a mouse receiving US stimulation at POA. The US transducer probe is marked by dotted circles. b, BAT temperature (TBAT), tail temperature (Ttail) and physical activity of mice with US stimulation at POA (US+, n = 12 mice) compared to two control groups: mice without US sonication (US–, n = 12 mice) and mice with US stimulation at the cortex as an off-target control (off-target, n = 6 mice). US sonication is indicated by the pink bars. c, Core body temperature (Tcore), metabolic rate (VO2) and RQ (VCO2/VO2) for the US+ (n = 13 mice for Tcore and n = 17 mice for VO2 and RQ), US– (n = 14 mice for Tcore and n = 18 mice for VO2 and RQ) and off-target groups (n = 4 mice for Tcore, VO2 and RQ) (top, from left to right). Max ΔTcore (lowest Tcore – mean Tcore before US), max ΔVO2 (lowest VO2 – mean VO2 before US) and max ΔRQ (lowest RQ – mean RQ before US) (bottom, from left to right). Male and female mice are represented as blue and pink dots, respectively. d, Representative ECG traces in mouse before (top) and after US stimulation (bottom). e, Heart rate before and after US stimulation for the US+ (n = 9 mice), US– (n = 5 mice) and off-target (n = 5 mice, targeting at the hippocampus) groups (left). No significant difference was found between the off-target and the US– group throughout the entire recording time. Comparison of heart rate before US stimulation and the lowest heart rate achieved by US stimulation at POA within 10 min after US stimulation (right). bpm, beats per minute. Solid lines and shadows denote the mean ± s.e.m. Error bars denote s.e.m. Each dot represents one mouse. P values were calculated using a one-way analysis of variance followed by Dunnett’s post hoc test in c and e (left) comparing the US+ and off-target groups to the US– group, respectively and a two-tailed paired t-test in e (right).

