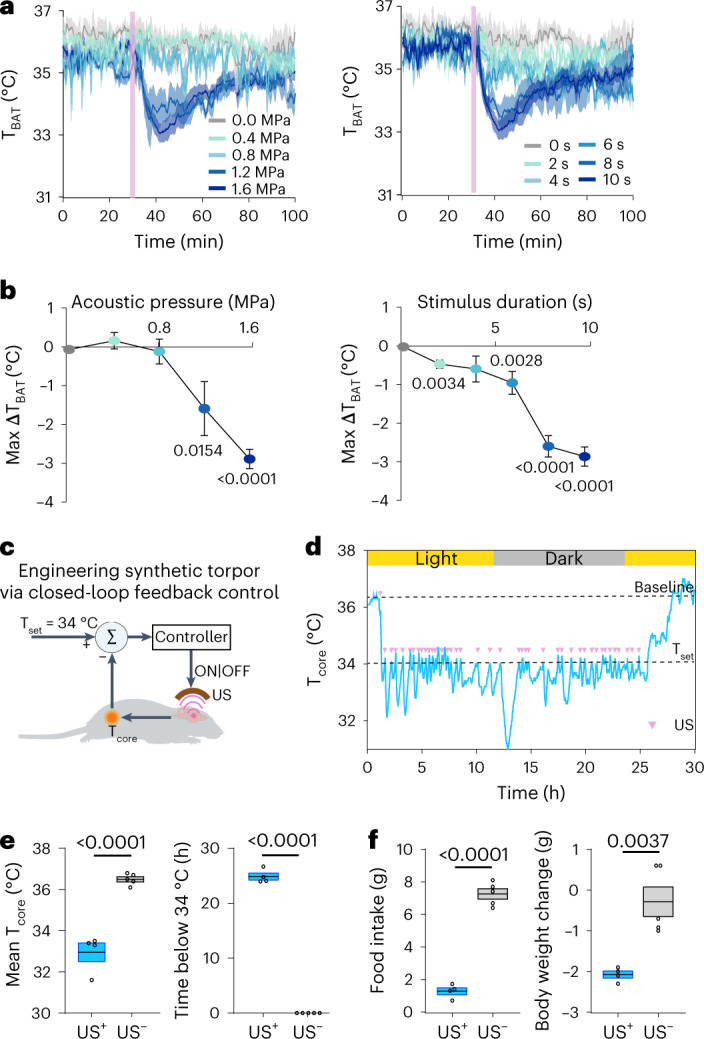
Fig. 3. Precise control of the depth and duration of ultrasound-induced hypothermia.

a, TBAT measured with US stimulation at different acoustic pressure (left) and stimulus duration (right). Solid lines and shadows in curves denote the mean ± s.e.m. b, Correlations between max ΔTBAT (lowest TBAT − mean TBAT before US) and acoustic pressure (left) or stimulus duration (right). n = 4 mice for the 0.4-MPa, 1.2-MPa, 2-s, 4-s and 6-s groups; n = 7 for the 0-MPa and 0-s groups; n = 3 for the 0.8-MPa and 8-s groups and n = 6 for the 1.6 MPa and 10-s groups). Error bars denote s.e.m. c, Schematic illustration of the closed-loop feedback control system for achieving long-duration UIH (created with BioRender.com). d, Representative Tcore measured in one mouse with the closed-loop feedback-controlled UIH. Each US stimulus is represented by a pink dot. e, Quantification of the mean Tcore (left) and duration when Tcore < 34 °C (right) achieved by the closed-loop feedback control system. f, Food intake (left) and body weight change (right) of the mice that underwent closed-loop feedback-controlled UIH (US+, n = 4 mice), compared to the control mice (US−, n = 4 mice). For the box plots, the center line and box boundaries indicate mean ± s.e.m. P values were calculated using a two-tailed unpaired t-test.
