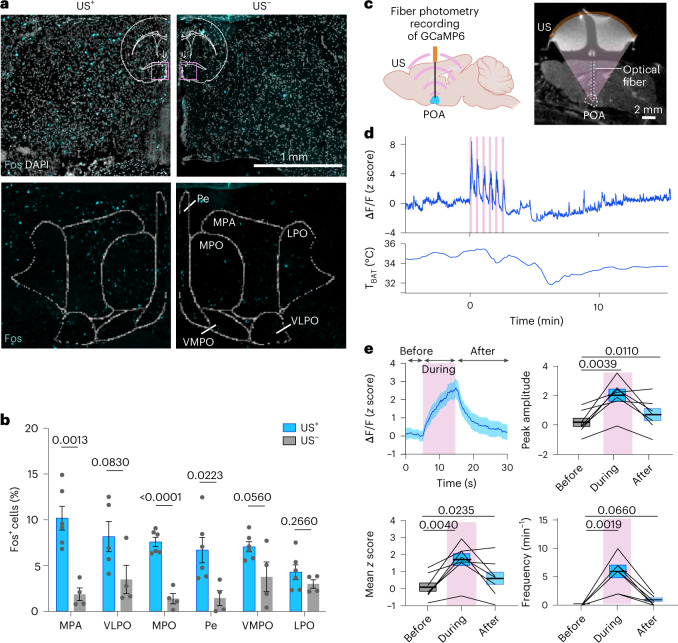
Fig. 4. Ultrasound induces hypothermia and hypometabolism by activating neurons in the POA.
a, Top: In situ hybridization analysis of the Fos marker in the POA region in mice with (US+) and without (US–) US stimulation. The insert shows the brain region where these images were obtained. Spatial distribution of the Fos signal registered with the mouse brain atlas (bottom). LPO, lateral preoptic area; VLPO, ventrolateral preoptic nucleus; VMPO, ventromedial preoptic nucleus. b, Fraction of Fos+ cells in different POA brain regions in the US+ and US– groups. n = 6 mice for the US+ group and n = 4 mice for the US- group, with the exception of the VLPO quantification in the US+ group where n = 5 mice were used. Error bars denote s.e.m. c, Schematic illustration for fiber photometry recording of neuronal Ca2+ activity in the POA targeted by US (created with BioRender.com) (left). MRI of a mouse shows the confocal alignment of optical fiber (green dotted line) and US transducer (brown) at the POA region (right). d, Representative Ca2+ activities (top) of POA neurons receiving US stimulation and the corresponding TBAT curve (bottom). US stimulation is composed of six individual stimuli. e, Ca2+ signal in response to each US pulse from n = 7 mice. Based on this Ca2+ signal, the peak amplitude, mean z score and frequency were quantified in three windows before (5 s), during (10 s) and after (15 s) US stimulation (n = 7 mice). For the box plots, the center line and box boundaries indicate mean ± s.e.m. P values were calculated by the unpaired two-tailed t-test (b) and paired two-tailed t-test (e).

