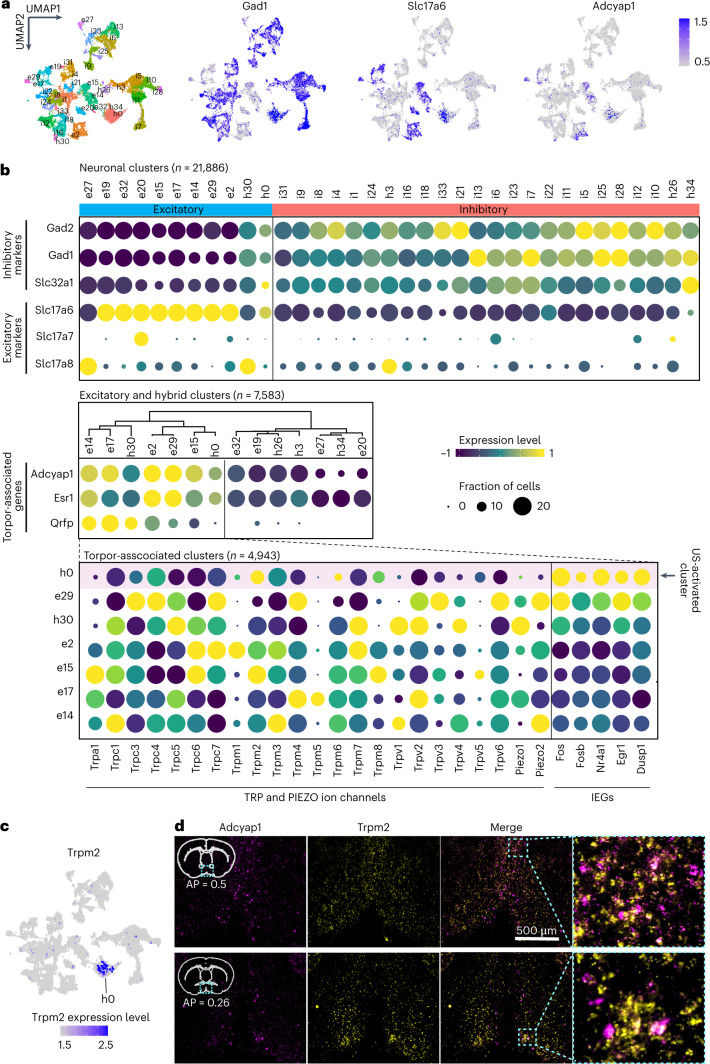
Fig. 5. Molecular characterization of POAUIH neurons.
a, Uniform Manifold Approximation and Projection (UMAP) plot of 21,886 neuronal nuclei. Different colors represent different neuronal populations. Expression levels of three main representative class-specific markers genes are color coded (blue) on UMAP: Gad1 for inhibitory clusters, Slc17a6 for excitatory clusters and Adcyap1+ for torpor-associated clusters. b, Expression of excitatory and inhibitory marker genes across different neuronal cell types (organized by k-means clustering) (top). Expression of torpor-associated marker genes (Adcyap1, Esr1 and Qrfp) across excitatory and hybrid neuronal populations (clustered based on these torpor-associated genes) (middle). Expression of all the genes encoding TRP and PIEZO channel families across all the torpor-associated clusters, which were ranked by the expression level of IEGs (bottom). The pink bar indicates the cluster that was activated by US. c, The expression level of Trpm2 is color coded (blue) on UMP. US-activated torpor-associated h0 cluster is labeled in the plot. d, Representative FISH image of Adcyap1 and Trpm2 in POA region of two coronal sections from different levels. FISH analyses were repeated in five mice. Anterior–posterior coordinates relative to bregma are indicated based on the Allen Mouse Brain Atlas62.

